4. (a) Complete the table of values for $y = 5 - x^2$ - Edexcel - GCSE Maths - Question 7 - 2020 - Paper 2
Question 7
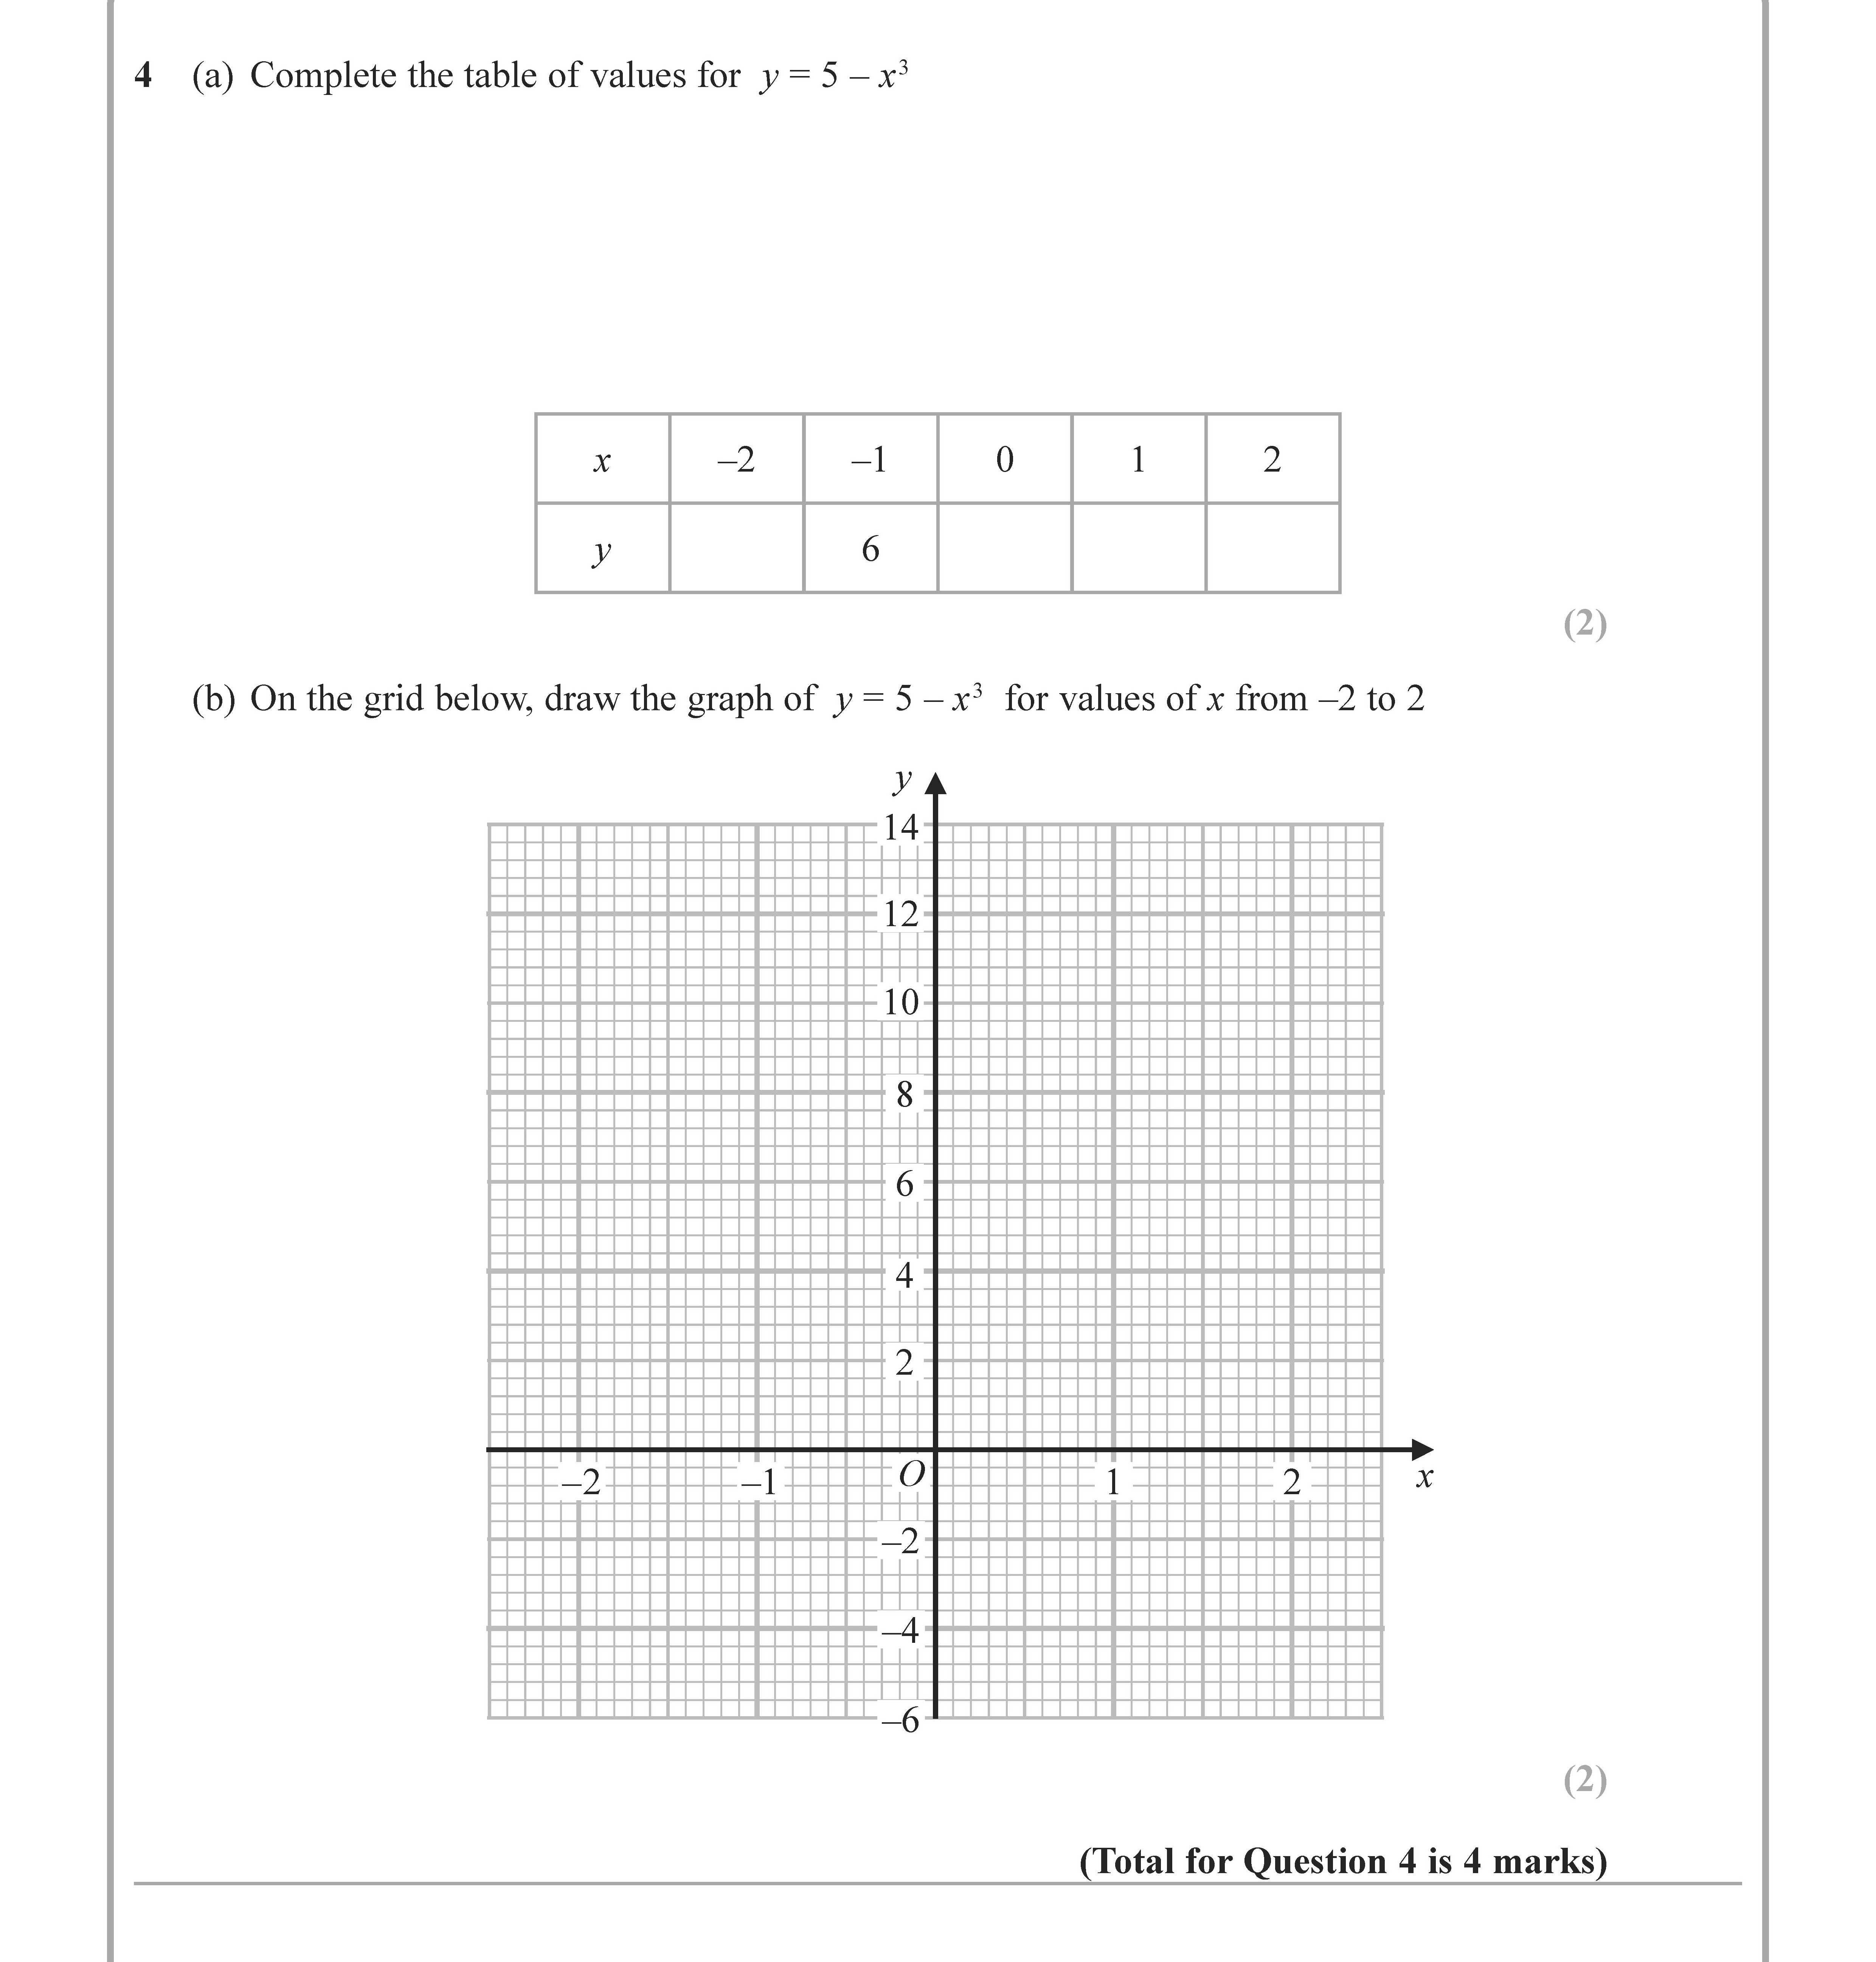
4. (a) Complete the table of values for $y = 5 - x^2$.
| x | -2 | -1 | 0 | 1 | 2 |
|----|----|----|---|---|---|
| y | | | | | |
(b) On the grid below... show full transcript
Worked Solution & Example Answer:4. (a) Complete the table of values for $y = 5 - x^2$ - Edexcel - GCSE Maths - Question 7 - 2020 - Paper 2
Step 1
Complete the table of values for $y = 5 - x^2$
96%
114 rated
Only available for registered users.
Sign up now to view full answer, or log in if you already have an account!
Answer
To complete the table, we will substitute the given values of x into the equation y=5−x2:
For x=−2:
y=5−(−2)2=5−4=1
For x=−1:
y=5−(−1)2=5−1=4
For x=0:
y=5−(0)2=5−0=5
For x=1:
y=5−(1)2=5−1=4
For x=2:
y=5−(2)2=5−4=1
Thus, the completed table is:
x
-2
-1
0
1
2
y
1
4
5
4
1
Step 2
On the grid below, draw the graph of $y = 5 - x^2$ for values of $x$ from -2 to 2
99%
104 rated
Only available for registered users.
Sign up now to view full answer, or log in if you already have an account!
Answer
To draw the graph of y=5−x2, we will plot the points we calculated from the table:
For x=−2, y=1 (Point: (-2, 1))
For x=−1, y=4 (Point: (-1, 4))
For x=0, y=5 (Point: (0, 5))
For x=1, y=4 (Point: (1, 4))
For x=2, y=1 (Point: (2, 1))
After plotting these points on the grid and connecting them, we will see a downward-facing parabola that opens downwards, reaching its maximum at (0, 5).