SimpleStudy Schools Book a Demo We can give expert advice on our plans and what will be the best option for your school.
Parents Pricing Home GCSE Edexcel Maths The Circle The histogram gives information about the distribution of the weights of some onions grown by a farmer
The histogram gives information about the distribution of the weights of some onions grown by a farmer - Edexcel - GCSE Maths - Question 22 - 2019 - Paper 3 Question 22
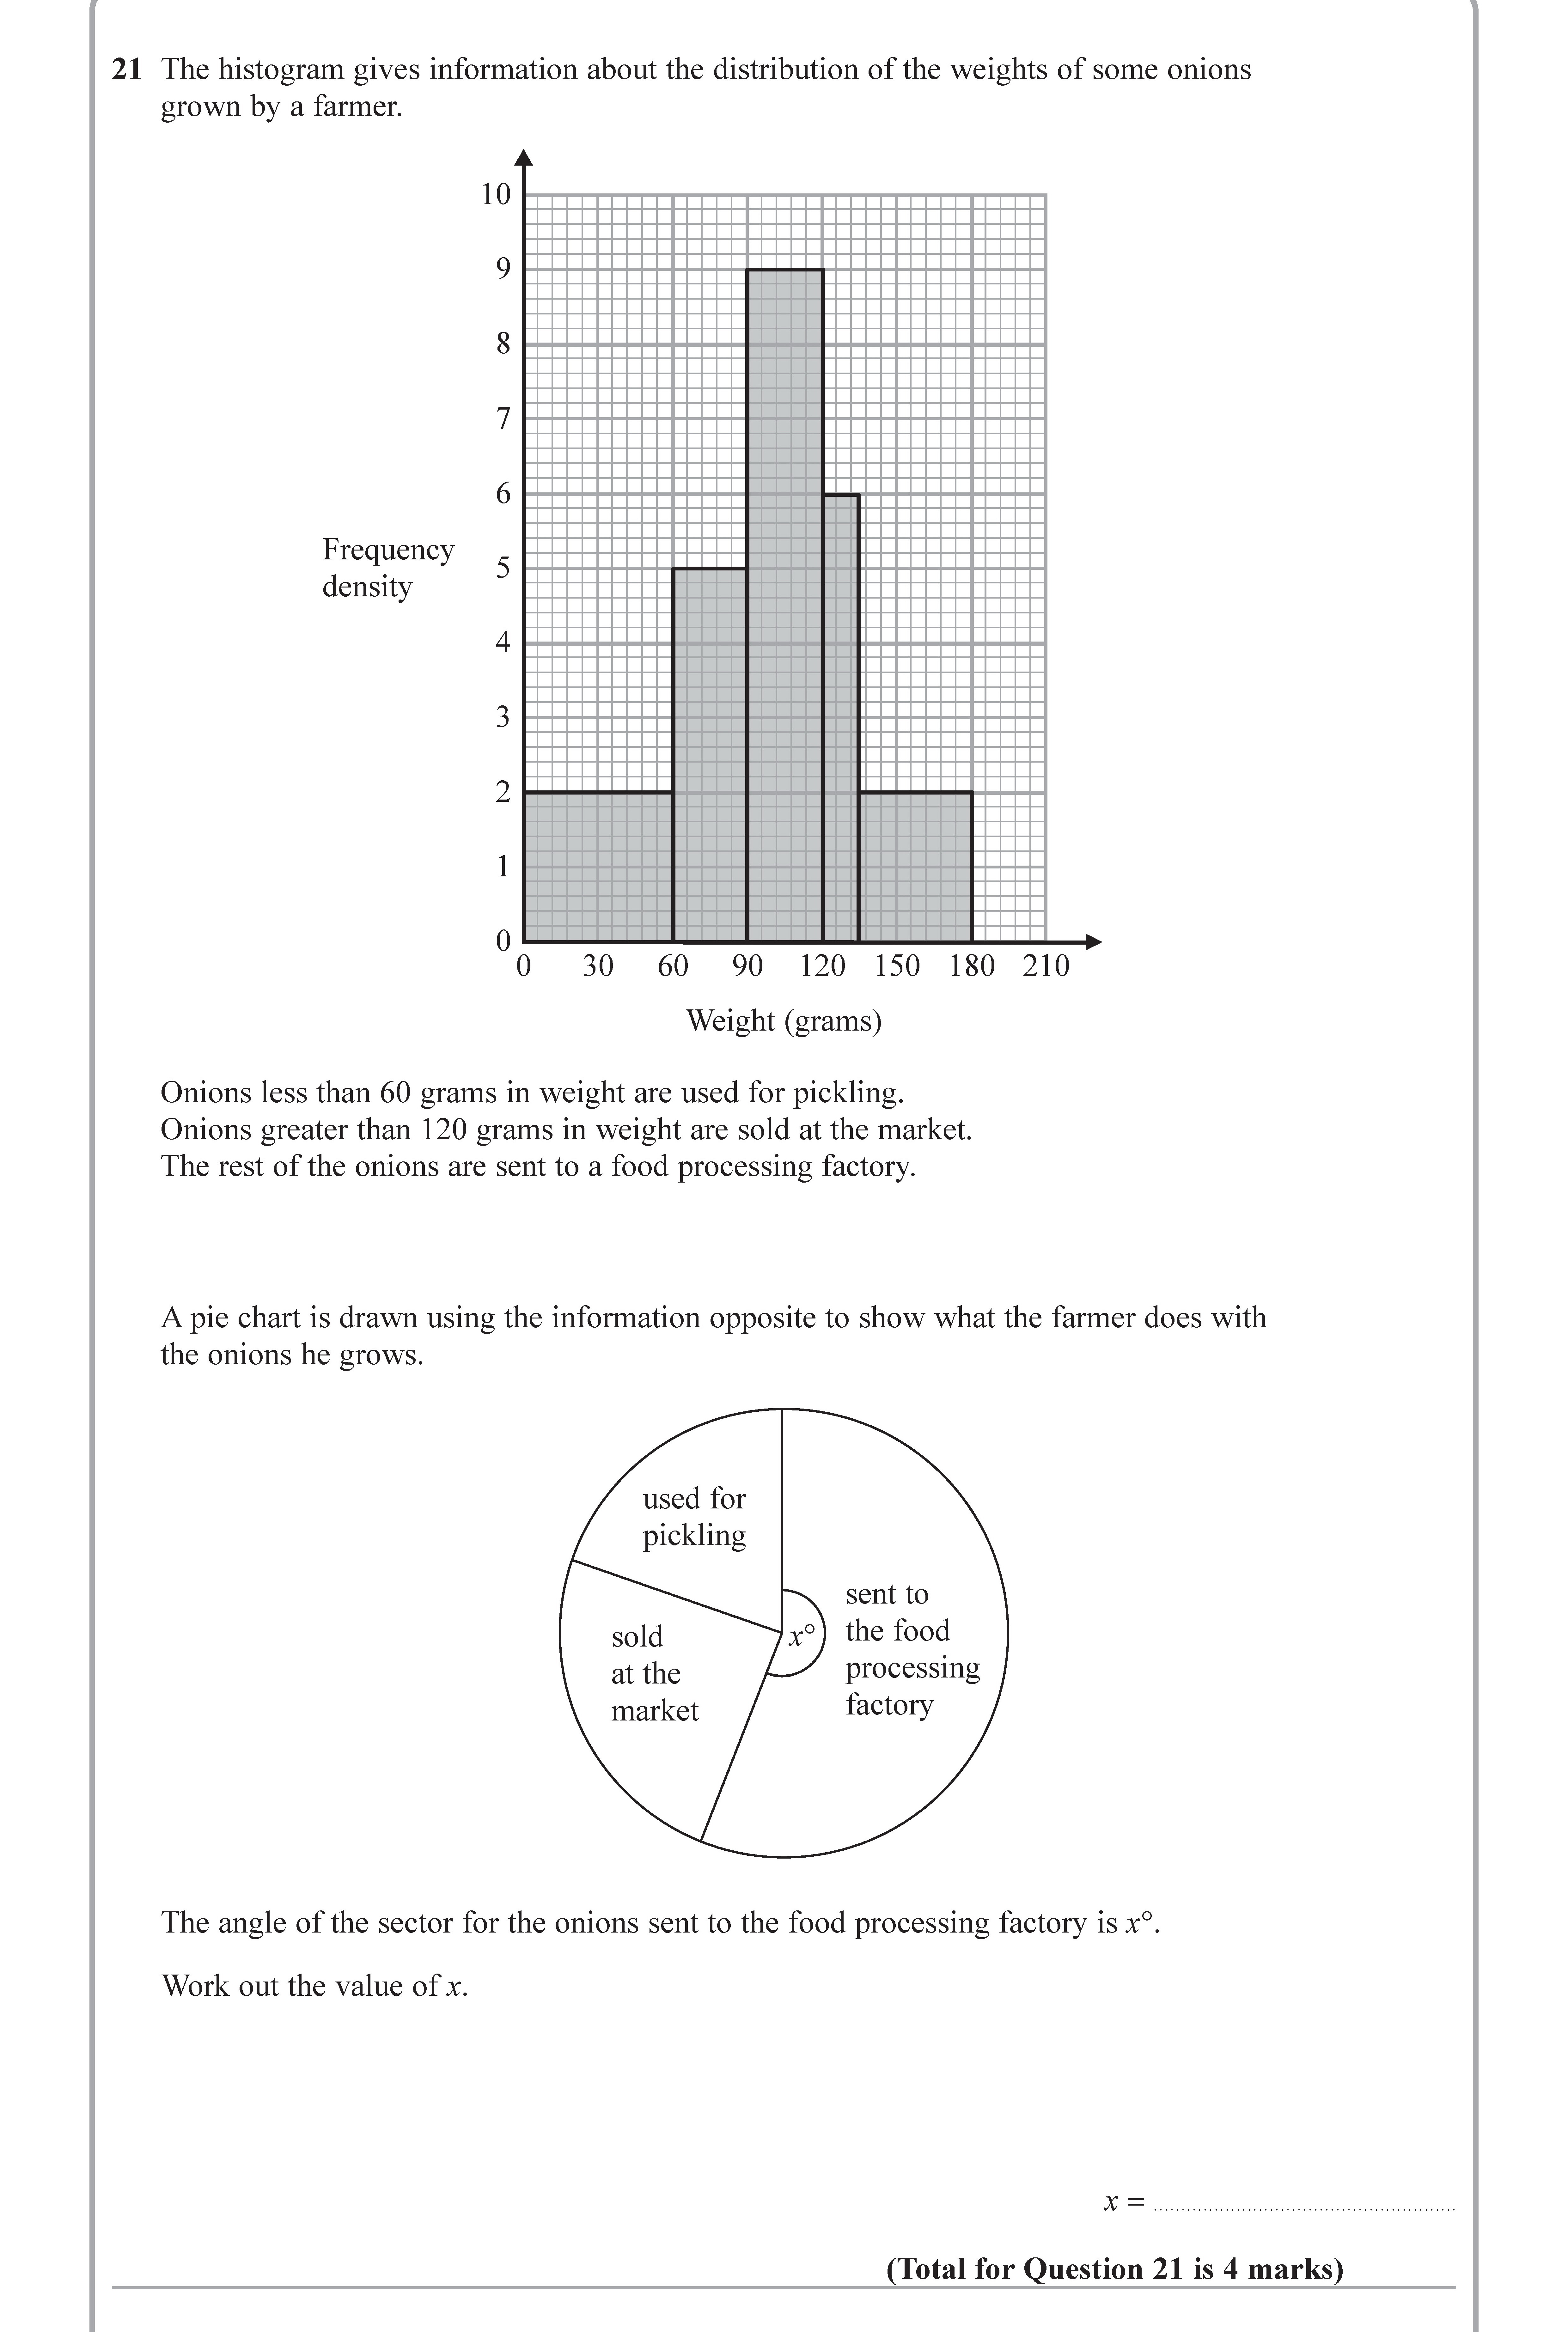
View full question The histogram gives information about the distribution of the weights of some onions grown by a farmer.
Onions less than 60 grams in weight are used for pickling.
O... show full transcript
View marking scheme Worked Solution & Example Answer:The histogram gives information about the distribution of the weights of some onions grown by a farmer - Edexcel - GCSE Maths - Question 22 - 2019 - Paper 3
Find total frequency Only available for registered users.
Sign up now to view full answer, or log in if you already have an account!
To find the total area under the histogram, we add the areas of each bar. For the given histogram:
The bar from 0 to 60 grams has a height of 5.
The bar from 60 to 90 grams has a height of 9.
The bar from 90 to 120 grams has a height of 15.
The bar from 120 to 180 grams has a height of 3.
The bar from 180 to 210 grams has a height of 0.
Calculating the total frequency:
e x t T o t a l F r e q u e n c y = ( 60 − 0 ) × 5 + ( 90 − 60 ) × 9 + ( 120 − 90 ) × 15 + ( 180 − 120 ) × 3 + ( 210 − 180 ) × 0 ext{Total Frequency} = (60 - 0) \times 5 + (90 - 60) \times 9 + (120 - 90) \times 15 + (180 - 120) \times 3 + (210 - 180) \times 0 e x t T o t a lF re q u e n cy = ( 60 − 0 ) × 5 + ( 90 − 60 ) × 9 + ( 120 − 90 ) × 15 + ( 180 − 120 ) × 3 + ( 210 − 180 ) × 0
This simplifies to:
= 60 × 5 + 30 × 9 + 30 × 15 + 60 × 3 = 60 \times 5 + 30 \times 9 + 30 \times 15 + 60 \times 3 = 60 × 5 + 30 × 9 + 30 × 15 + 60 × 3 = 300 + 270 + 450 + 180 = 1200 = 300 + 270 + 450 + 180 = 1200 = 300 + 270 + 450 + 180 = 1200
Calculate onions sent to the factory Only available for registered users.
Sign up now to view full answer, or log in if you already have an account!
From the information provided:
Onions less than 60 grams: Used for pickling = 300.
Onions greater than 120 grams: Sold at the market = 180.
Thus, the number of onions sent to the food processing factory:
e x t O n i o n s = Total − ( Pickling + Market ) ext{Onions} = \text{Total} - (\text{Pickling} + \text{Market}) e x t O ni o n s = Total − ( Pickling + Market ) = 1200 − ( 300 + 180 ) = 1200 - (300 + 180) = 1200 − ( 300 + 180 ) = 1200 − 480 = 720 = 1200 - 480 = 720 = 1200 − 480 = 720
Calculate the angle for the pie chart Only available for registered users.
Sign up now to view full answer, or log in if you already have an account!
To find the angle x x x
x = ( Number of onions sent to factory Total number of onions ) × 360 x = \left(\frac{\text{Number of onions sent to factory}}{\text{Total number of onions}}\right) \times 360 x = ( Total number of onions Number of onions sent to factory ) × 360
Substituting the values:
x = ( 720 1200 ) × 360 ≈ 216 x = \left(\frac{720}{1200}\right) \times 360\approx 216 x = ( 1200 720 ) × 360 ≈ 216
Thus, the value of x x x
Join the GCSE students using SimpleStudy...97% of StudentsReport Improved Results
98% of StudentsRecommend to friends
100,000+ Students Supported
1 Million+ Questions answered
© 2025 SimpleStudy. All rights reserved