Here is the graph of $y = ext{sin}^3(x)$ for $-180 \leq x \leq 180$ - Edexcel - GCSE Maths - Question 18 - 2018 - Paper 1
Question 18
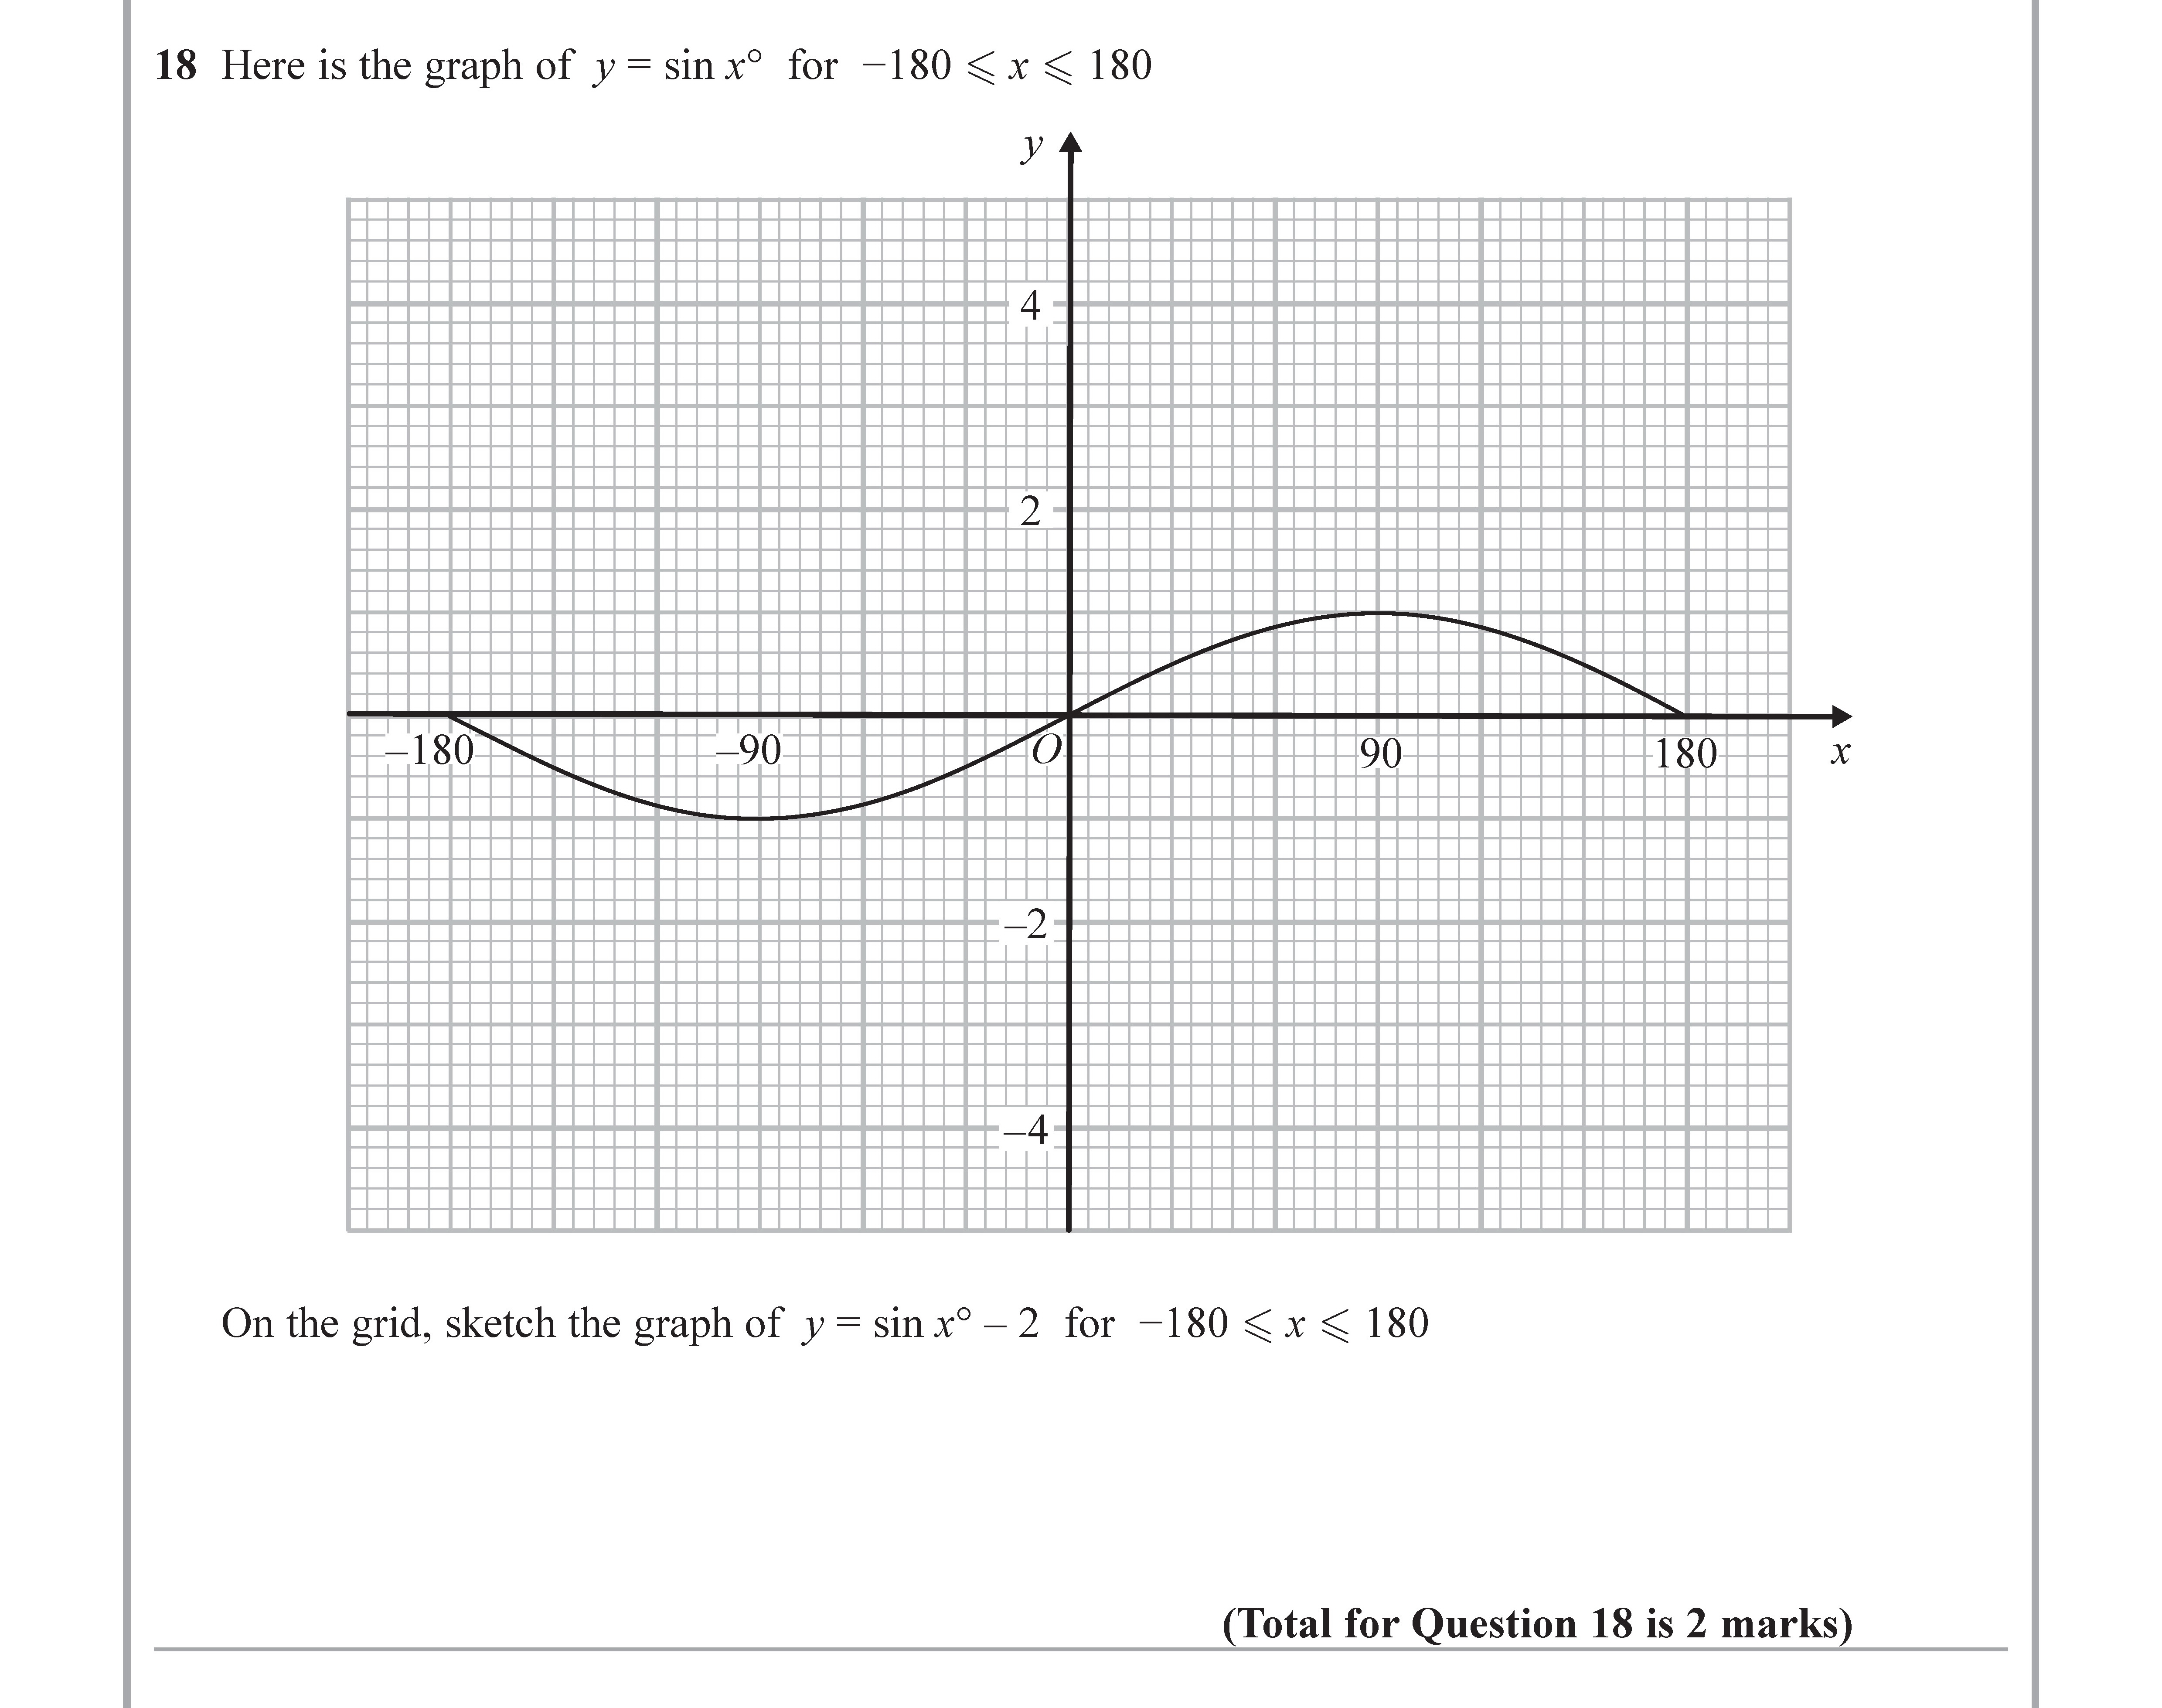
Here is the graph of $y = ext{sin}^3(x)$ for $-180 \leq x \leq 180$.
On the grid, sketch the graph of $y = ext{sin}^2(x) - 2$ for $-180 \leq x \leq 180$.
Worked Solution & Example Answer:Here is the graph of $y = ext{sin}^3(x)$ for $-180 \leq x \leq 180$ - Edexcel - GCSE Maths - Question 18 - 2018 - Paper 1
Step 1
Step 1: Understanding the Function
96%
114 rated
Only available for registered users.
Sign up now to view full answer, or log in if you already have an account!
Answer
The given function is y=extsin2(x)−2. The extsin2(x) function oscillates between 0 and 1. Therefore, the range of y=extsin2(x) is [0, 1]. By subtracting 2, the range of y=extsin2(x)−2 becomes [-2, -1].
Step 2
Step 2: Key Points and Intercepts
99%
104 rated
Only available for registered users.
Sign up now to view full answer, or log in if you already have an account!
Answer
To sketch the graph, identify key angles. For example, at x=0, y=extsin2(0)−2=0−2=−2; hence the point (0, -2) exists. Similarly, at x=90, y=extsin2(90)−2=1−2=−1, giving the point (90, -1). At x=−90, the same value holds due to sine's symmetry.
Step 3
Step 3: Sketching the Graph
96%
101 rated
Only available for registered users.
Sign up now to view full answer, or log in if you already have an account!
Answer
The graph will be a smooth curve that oscillates between the points steered by the above evaluations, remaining in the range of [-2, -1]. It will touch the line y=−2 at x=0 and reach y=−1 at x=90 and x=−90, with equal negative bumps around these points reflecting sinusoidal behavior.