The graph shows the volume of liquid (L litres) in a container at time t seconds - Edexcel - GCSE Maths - Question 13 - 2018 - Paper 3
Question 13
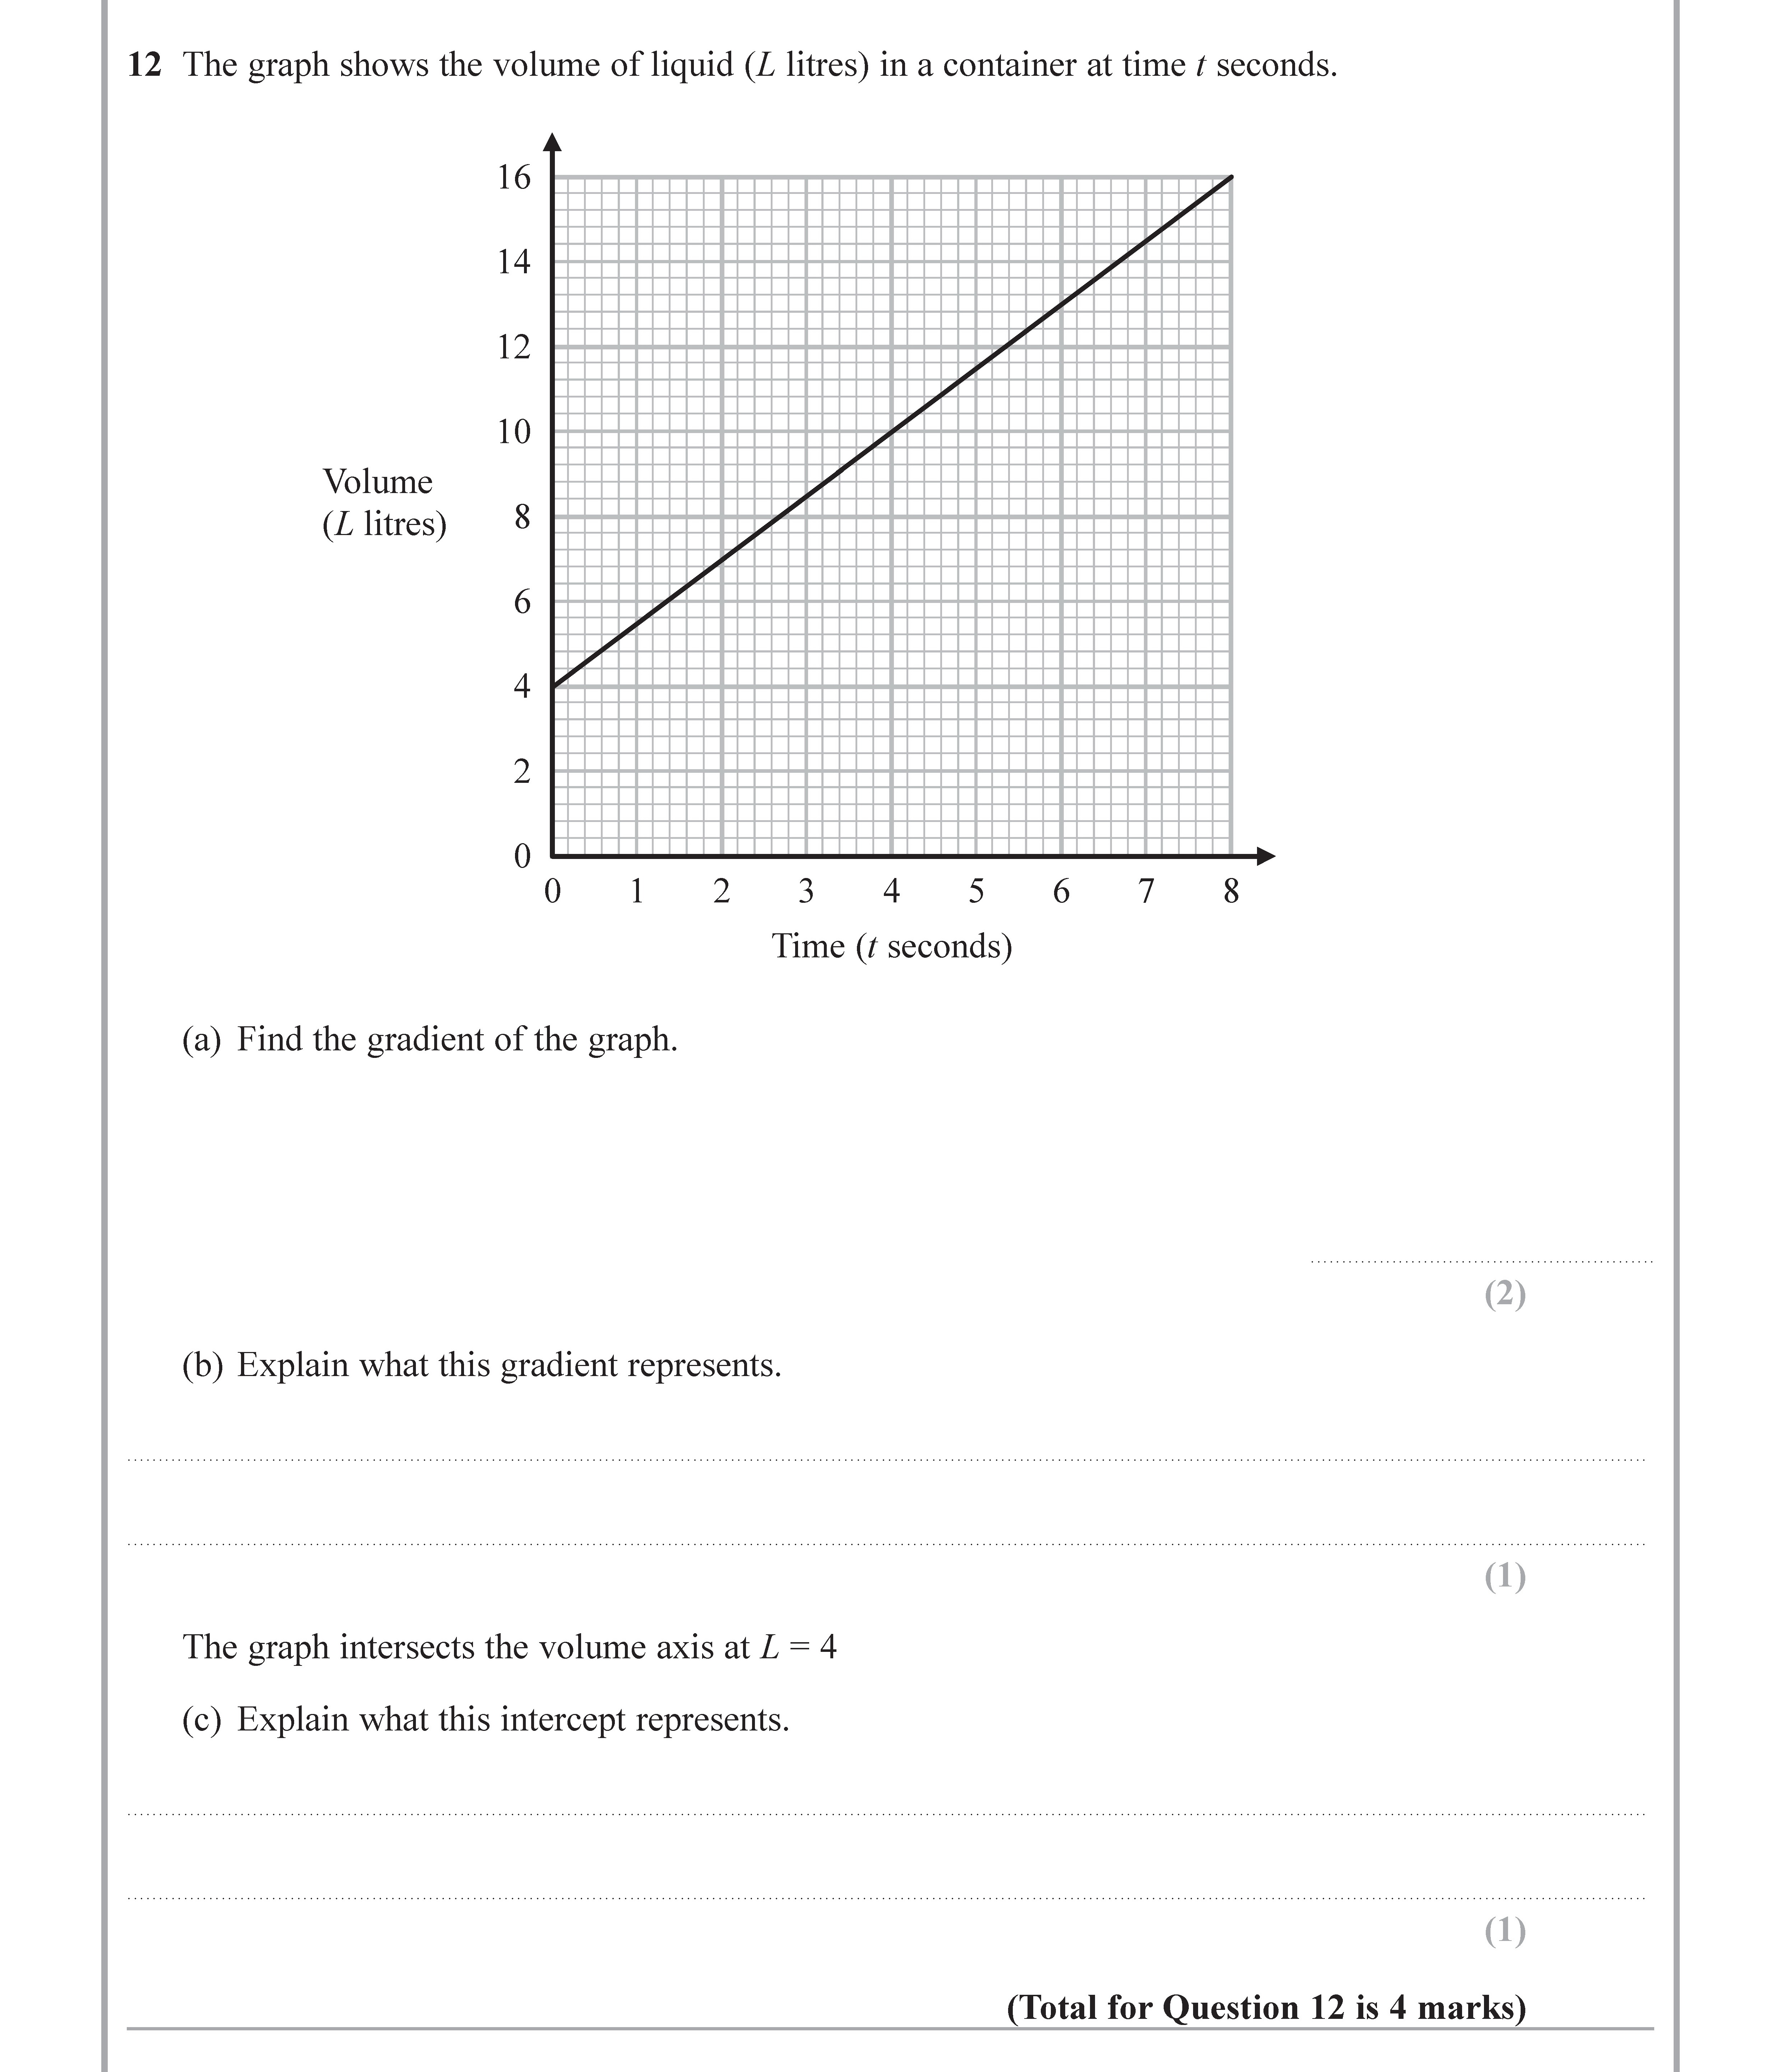
The graph shows the volume of liquid (L litres) in a container at time t seconds.
(a) Find the gradient of the graph.
(b) Explain what this gradient represents.
(... show full transcript
Worked Solution & Example Answer:The graph shows the volume of liquid (L litres) in a container at time t seconds - Edexcel - GCSE Maths - Question 13 - 2018 - Paper 3
Step 1
Find the gradient of the graph.
96%
114 rated
Only available for registered users.
Sign up now to view full answer, or log in if you already have an account!
Answer
To find the gradient of the graph, use the formula for the gradient:
ext{Gradient} = rac{ ext{Change in Volume}}{ ext{Change in Time}}
From the graph:
The change in volume from 0 L to 16 L occurs over 8 seconds.
Thus:
extGradient=8−016−0=816=2
Therefore, the gradient of the graph is 2 L/s.
Step 2
Explain what this gradient represents.
99%
104 rated
Only available for registered users.
Sign up now to view full answer, or log in if you already have an account!
Answer
The gradient of the graph represents the rate of change of the volume of liquid in the container with respect to time. In this case, a gradient of 2 L/s indicates that the container is filling with liquid at a rate of 2 litres per second.
Step 3
Explain what this intercept represents.
96%
101 rated
Only available for registered users.
Sign up now to view full answer, or log in if you already have an account!
Answer
The intercept of the graph occurs at L = 4. This point indicates that at 0 seconds, the volume of liquid in the container is 4 litres. In other words, this is the initial amount of liquid present in the container before any time has passed.