Photo AI
2. Figure 3 shows a Geiger-Müller (GM) tube used for measuring radioactivity - Edexcel - GCSE Physics Combined Science - Question 2 - 2018 - Paper 1
Question 2
2. Figure 3 shows a Geiger-Müller (GM) tube used for measuring radioactivity. (a) Describe how a teacher should use a Geiger-Müller (GM) tube to compare the count-r... show full transcript
Worked Solution & Example Answer:2. Figure 3 shows a Geiger-Müller (GM) tube used for measuring radioactivity - Edexcel - GCSE Physics Combined Science - Question 2 - 2018 - Paper 1
Step 1
Describe how a teacher should use a Geiger-Müller (GM) tube to compare the count-rates from two different radioactive rocks.

Answer
To effectively use a Geiger-Müller (GM) tube, the teacher should follow these steps:
-
Setup: Place the Geiger-Müller tube in proximity to the two different radioactive rocks, ensuring they are not positioned ‘in’ the tube but are close enough for accurate readings.
-
Measuring Count Rates: Measure the count rates separately for each rock over the same time period, for example, 1 minute.
-
Consistency in Measurements: Maintain a consistent distance between the source of the radioactivity (the rocks) and the Geiger-Müller tube during the measurements.
-
Background Count: Take into account or measure the background radiation to ensure that the readings are accurate and reflect only the radioactivity from the rocks.
-
Repeat Measurements: To obtain reliable data, repeat the count for each rock multiple times and take averages of the readings.
Step 2
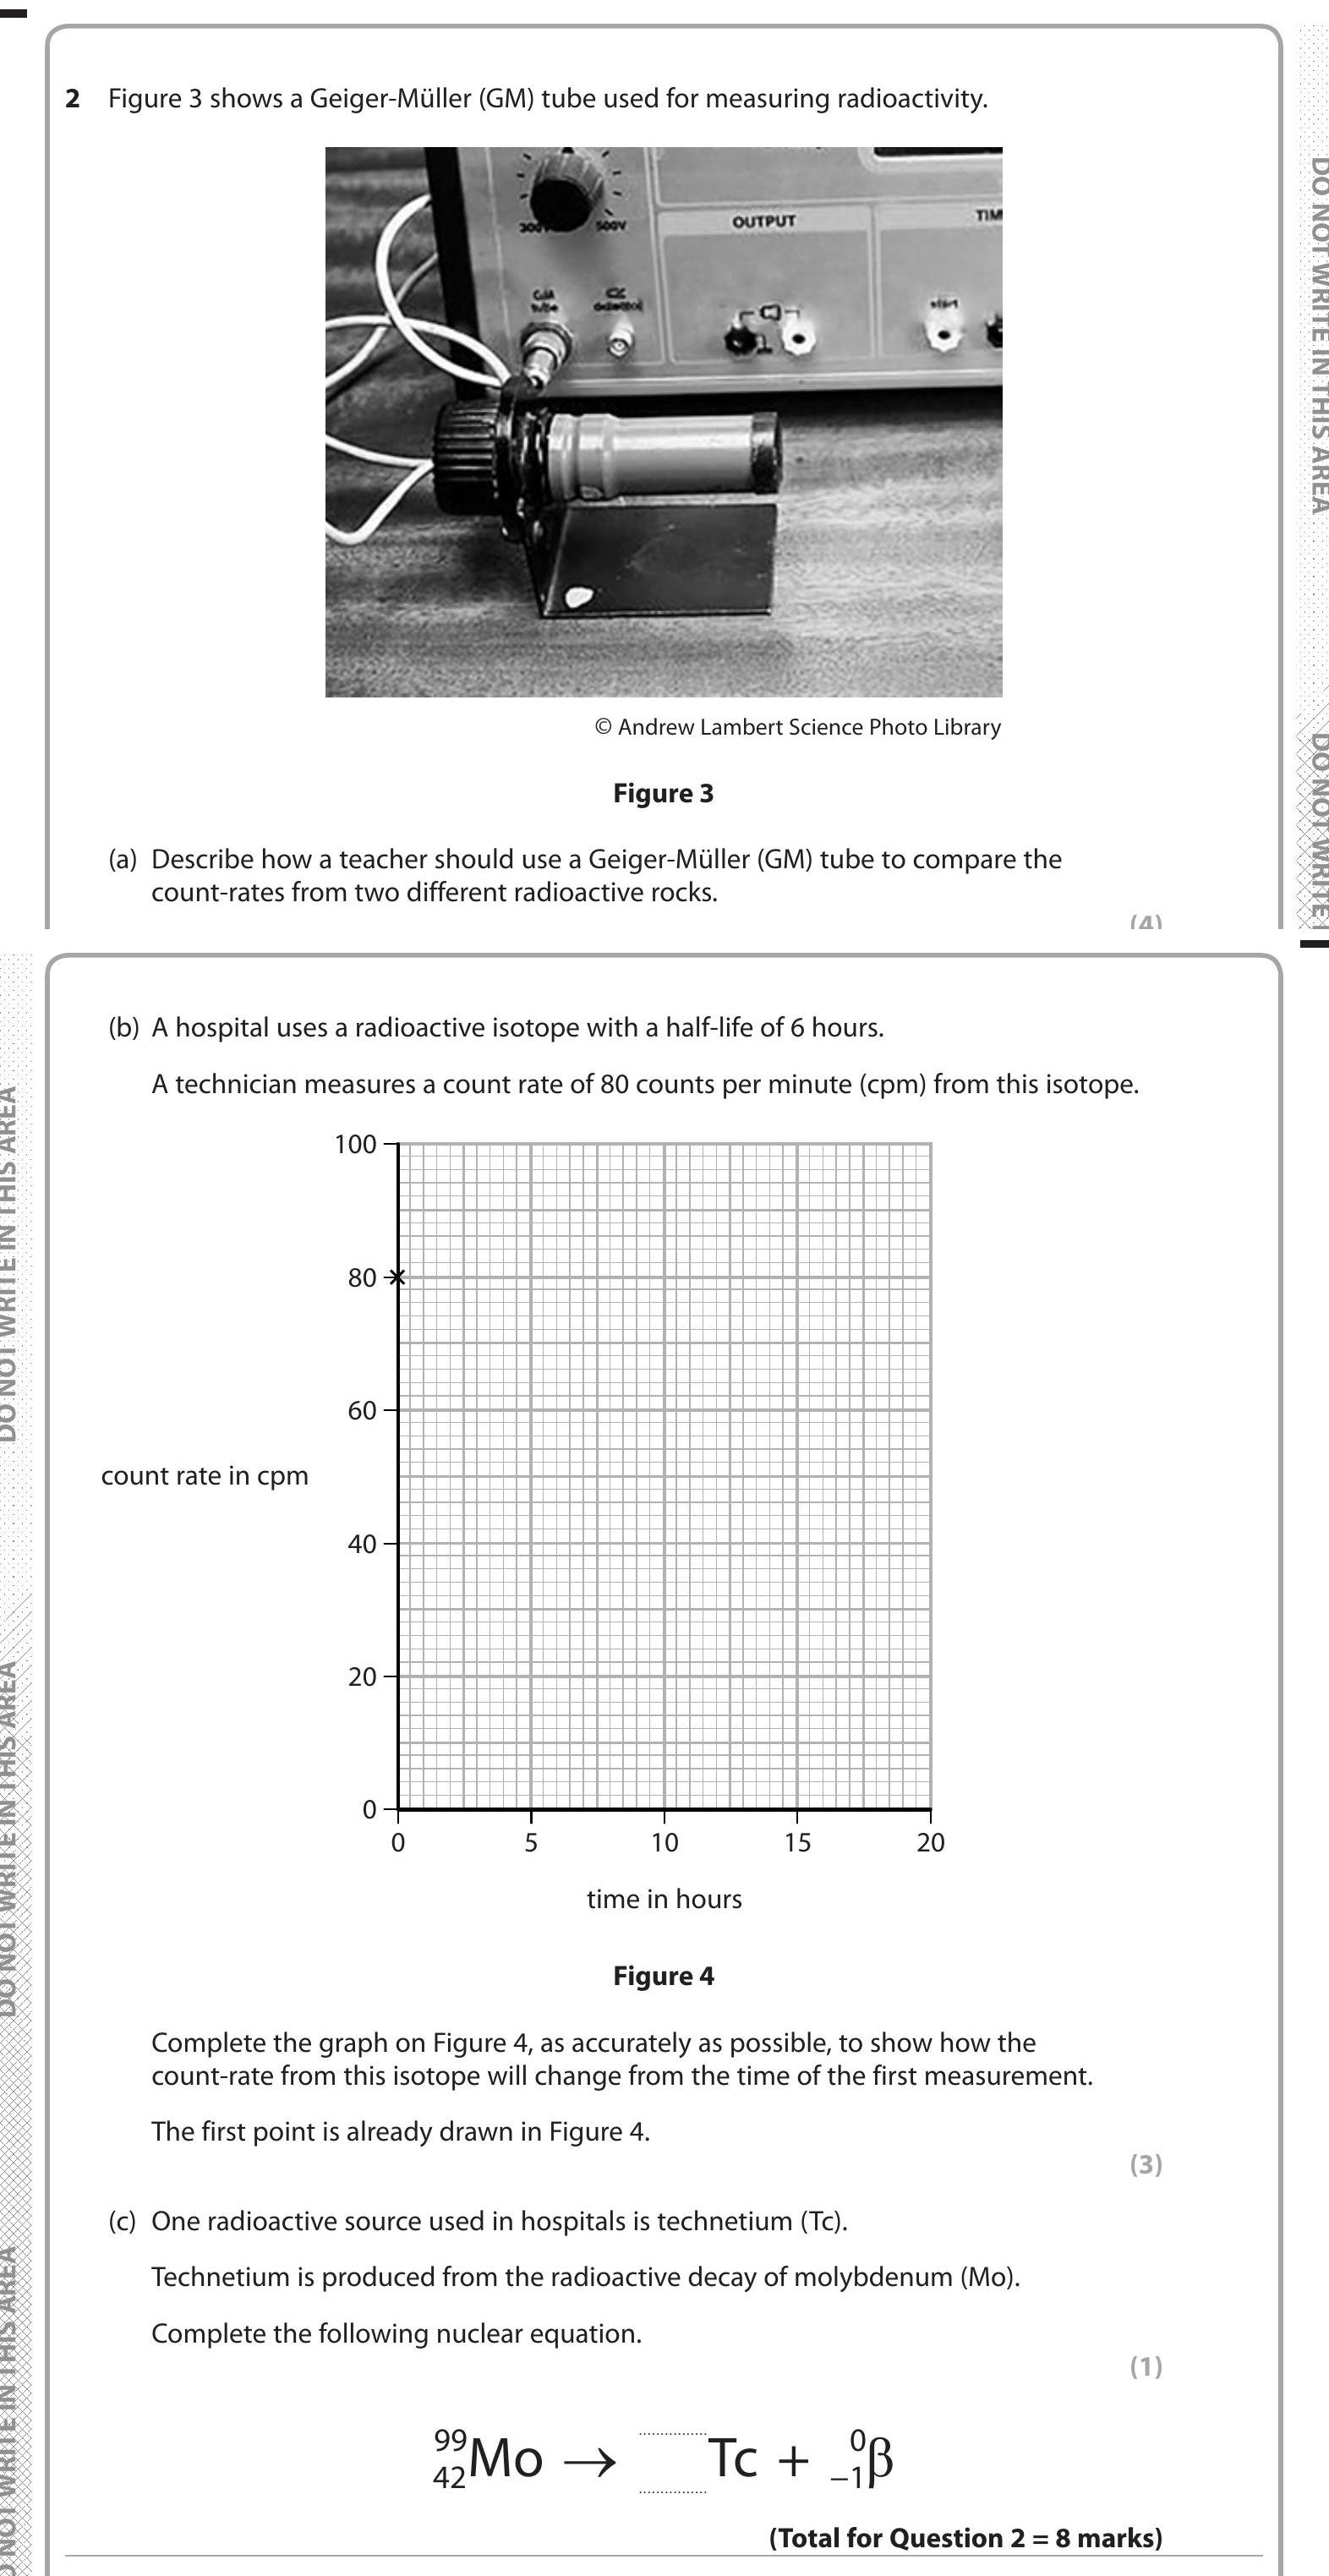
Complete the graph on Figure 4, as accurately as possible, to show how the count-rate from this isotope will change from the time of the first measurement.
Answer
To complete the graph:
- Start the graph at 80 cpm at time 0 hours, the initial measurement point.
- After one half-life (6 hours), plot the point at 40 cpm.
- After the second half-life (12 hours), plot the point at 20 cpm.
- After the third half-life (18 hours), plot the point at 10 cpm.
- Connect the points using a smooth, decreasing curve, indicating a gradual decay in count rate over time.
Step 3