Figure 1 shows a speed/time graph for a car - Edexcel - GCSE Physics Combined Science - Question 1 - 2019 - Paper 1
Question 1
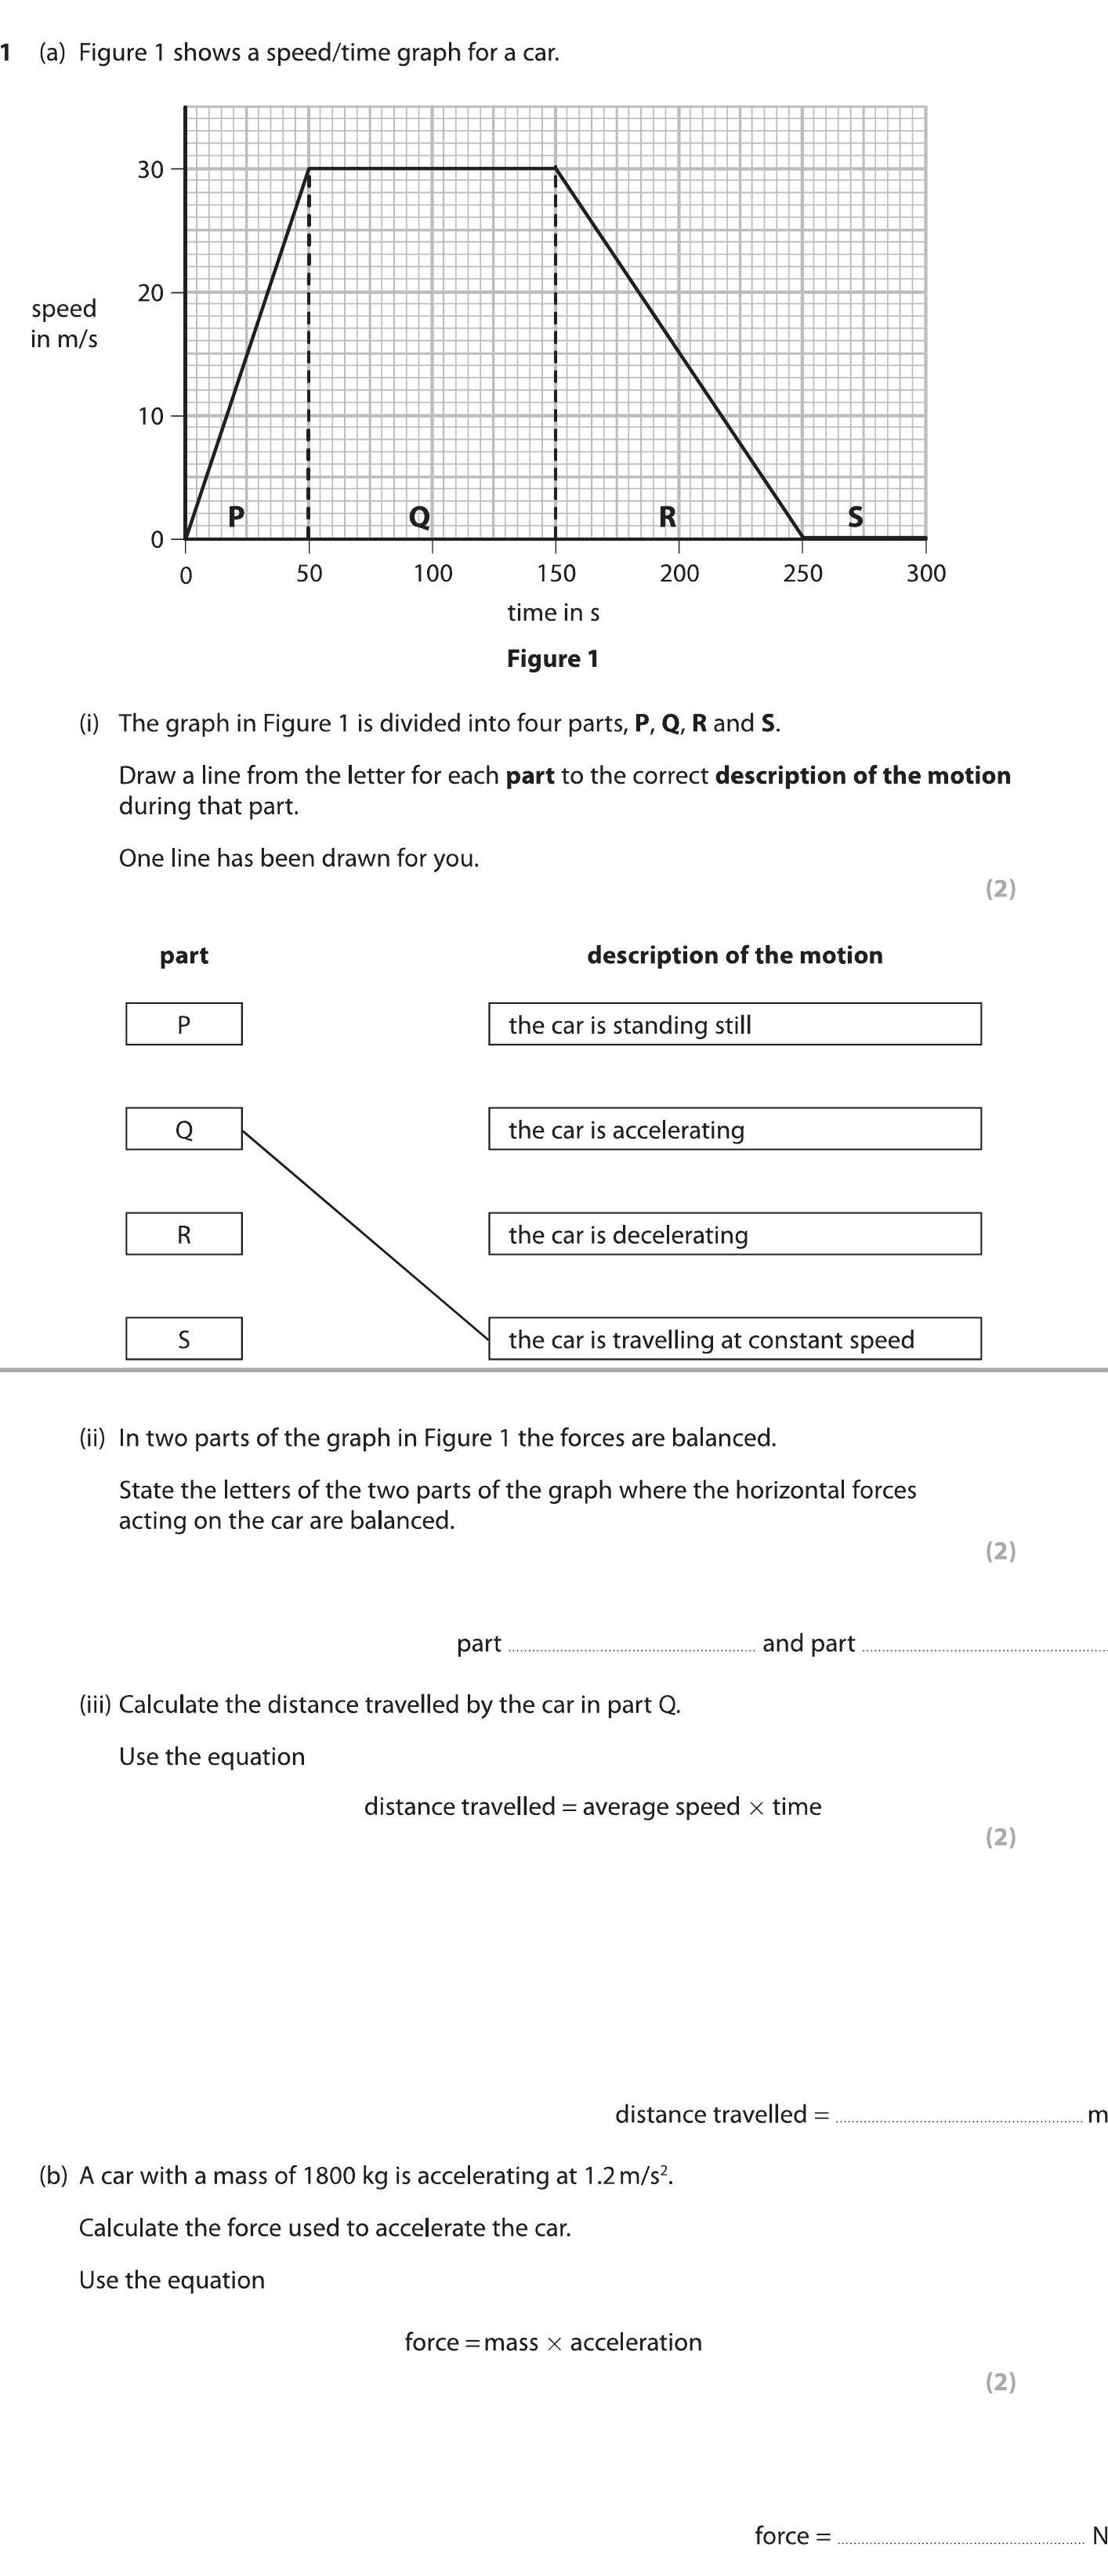
Figure 1 shows a speed/time graph for a car.
(i) The graph in Figure 1 is divided into four parts, P, Q, R and S.
Draw a line from the letter for each part to the ... show full transcript
Worked Solution & Example Answer:Figure 1 shows a speed/time graph for a car - Edexcel - GCSE Physics Combined Science - Question 1 - 2019 - Paper 1
Step 1
P
96%
114 rated
Only available for registered users.
Sign up now to view full answer, or log in if you already have an account!
Answer
The car is standing still.
Step 2
Q
99%
104 rated
Only available for registered users.
Sign up now to view full answer, or log in if you already have an account!
Answer
The car is accelerating.
Step 3
R
96%
101 rated
Only available for registered users.
Sign up now to view full answer, or log in if you already have an account!
Answer
The car is decelerating.
Step 4
S
98%
120 rated
Only available for registered users.
Sign up now to view full answer, or log in if you already have an account!
Answer
The car is travelling at constant speed.
Step 5
State the letters of the two parts of the graph where the horizontal forces acting on the car are balanced.
97%
117 rated
Only available for registered users.
Sign up now to view full answer, or log in if you already have an account!
Answer
Q and S
Step 6
Calculate the distance travelled by the car in part Q.
97%
121 rated
Only available for registered users.
Sign up now to view full answer, or log in if you already have an account!
Answer
To find the distance travelled during part Q, we can use the formula:
distance travelled = average speed × time.
From the graph, the average speed in part Q is approximately 30 m/s and the time taken is 100 seconds.
Thus,
distance travelled = 30 m/s × 100 s = 3000 m.
Step 7
Calculate the force used to accelerate the car.
96%
114 rated
Only available for registered users.
Sign up now to view full answer, or log in if you already have an account!
Answer
Using the equation:
force = mass × acceleration,
the mass of the car is 1800 kg and the acceleration is 1.2 m/s².