The graph in Figure 3 shows how the velocity of a car changes with time - Edexcel - GCSE Physics Combined Science - Question 2 - 2023 - Paper 1
Question 2
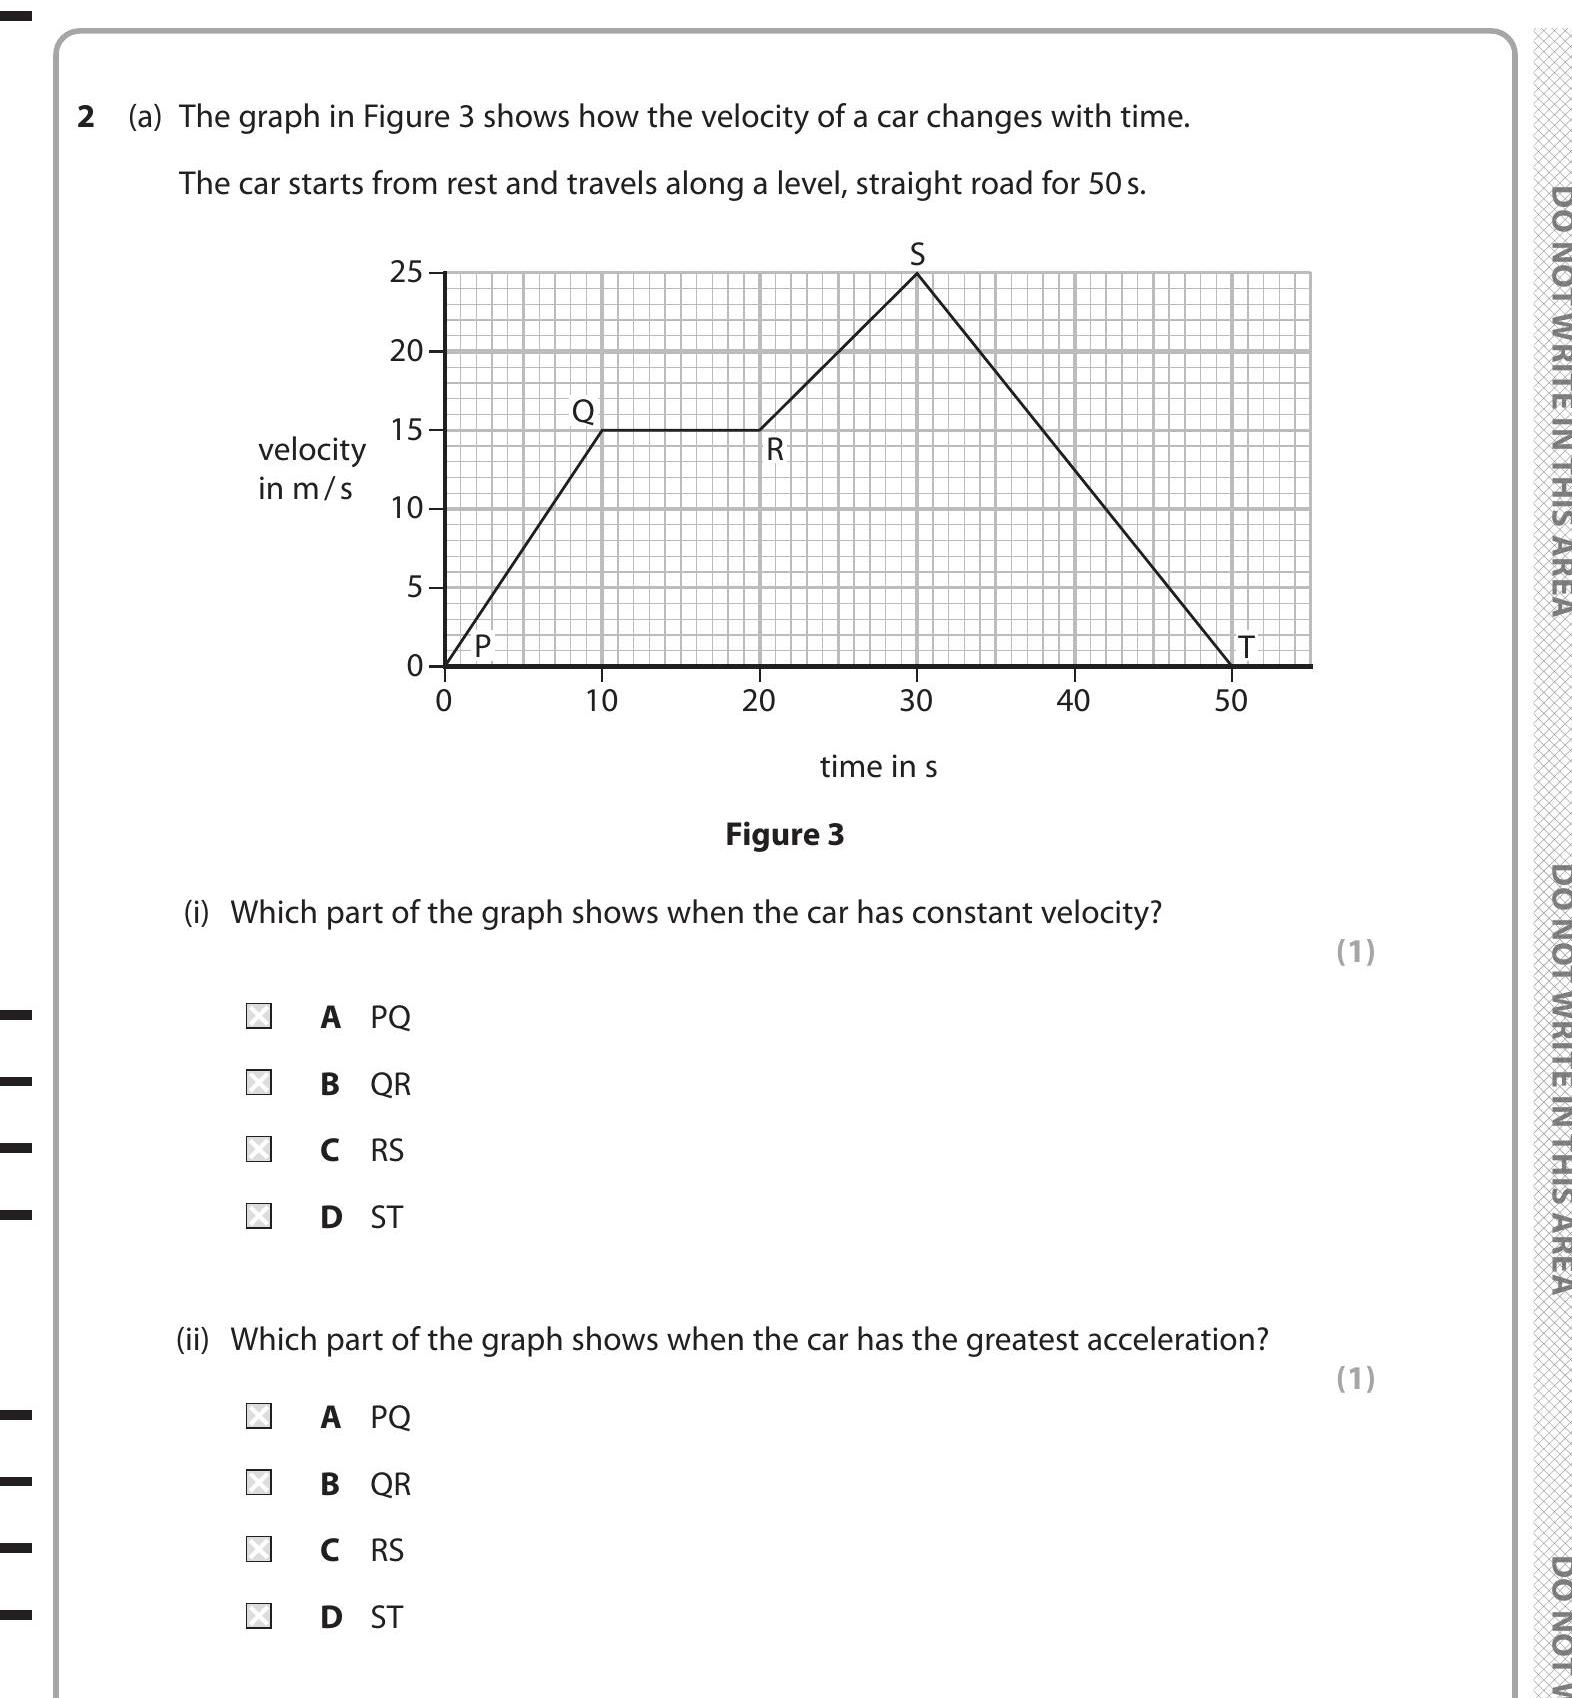
The graph in Figure 3 shows how the velocity of a car changes with time.
The car starts from rest and travels along a level, straight road for 50s.
(i) Which part o... show full transcript
Worked Solution & Example Answer:The graph in Figure 3 shows how the velocity of a car changes with time - Edexcel - GCSE Physics Combined Science - Question 2 - 2023 - Paper 1
Step 1
Which part of the graph shows when the car has constant velocity?
96%
114 rated
Only available for registered users.
Sign up now to view full answer, or log in if you already have an account!
Answer
The part of the graph that shows the car has constant velocity is segment QR. This is indicated by the horizontal line on the graph, where the velocity remains unchanged over time.
Step 2
Which part of the graph shows when the car has the greatest acceleration?
99%
104 rated
Only available for registered users.
Sign up now to view full answer, or log in if you already have an account!
Answer
The part of the graph that shows the car has the greatest acceleration is segment PQ. In this segment, the graph has the steepest upward slope, indicating an increase in velocity over time.