Figure 5 is a velocity/time graph for a lift moving upwards in a tall building - Edexcel - GCSE Physics Combined Science - Question 3 - 2023 - Paper 1
Question 3
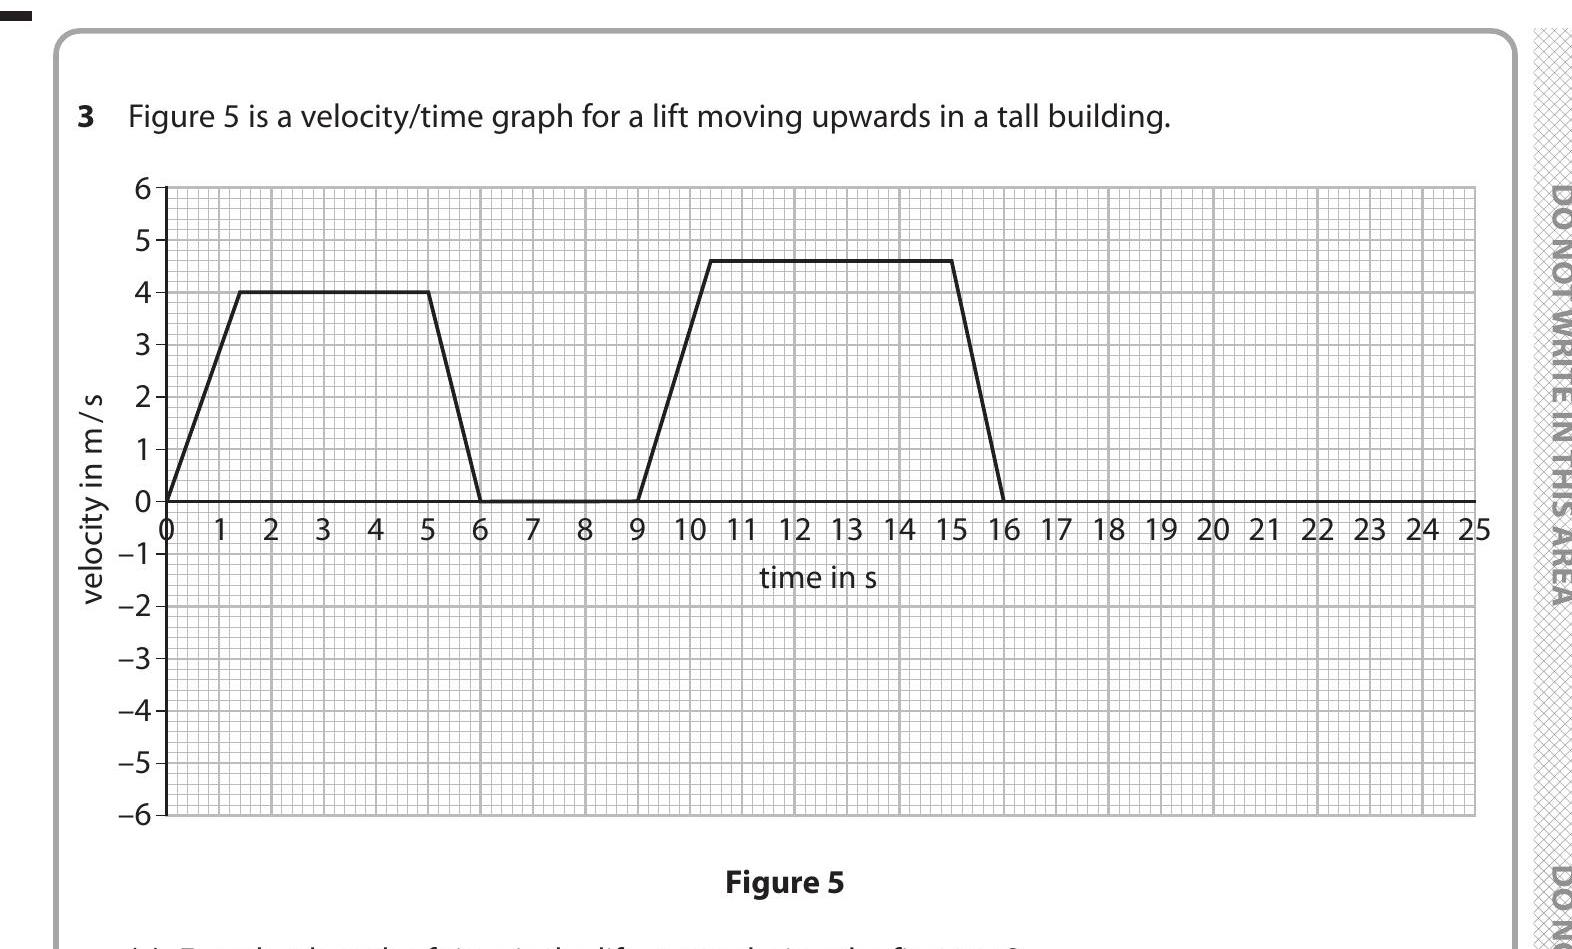
Figure 5 is a velocity/time graph for a lift moving upwards in a tall building.
Figure 5
Worked Solution & Example Answer:Figure 5 is a velocity/time graph for a lift moving upwards in a tall building - Edexcel - GCSE Physics Combined Science - Question 3 - 2023 - Paper 1
Step 1
Determine the velocity intervals
96%
114 rated
Only available for registered users.
Sign up now to view full answer, or log in if you already have an account!
Answer
Based on the velocity/time graph (Figure 5), the lift has three distinct velocity intervals: 0 m/s to 5 m/s (for 6 seconds), constant at 5 m/s (for 8 seconds), and finally dropping back to 0 m/s. The periods of acceleration/deceleration can also be noted from the graph.
Step 2
Calculate the distance traveled during each interval
99%
104 rated
Only available for registered users.
Sign up now to view full answer, or log in if you already have an account!
Answer
The distance traveled can be calculated using the formula:
extDistance=extVelocityimesextTime.
During the first interval (0 to 2s):
Velocity = 5 m/s, Time = 2s:
extDistance1=5imes2=10extm
During the second interval (2 to 10s):
Velocity = 5 m/s, Time = 8s:
extDistance2=5imes8=40extm
Lastly, during the third interval (10 to 12s), the lift comes to rest:
Velocity averages from 5 m/s to 0 m/s. This is an average velocity of 2.5 m/s, Time = 2s:
extDistance3=2.5imes2=5extm
Step 3
Sum the distances
96%
101 rated
Only available for registered users.
Sign up now to view full answer, or log in if you already have an account!
Answer
The total distance traveled by the lift is the sum of the distances from all intervals:
extTotalDistance=10+40+5=55extm.