Photo AI
2 (a) Figure 1 shows part of a wave - Edexcel - GCSE Physics - Question 2 - 2021 - Paper 1
Question 2
2 (a) Figure 1 shows part of a wave. Use data from Figure 1 to calculate the wavelength of the wave. wavelength = ____________________ cm (b) (i) Figure 2 shows a... show full transcript
Worked Solution & Example Answer:2 (a) Figure 1 shows part of a wave - Edexcel - GCSE Physics - Question 2 - 2021 - Paper 1
Step 1
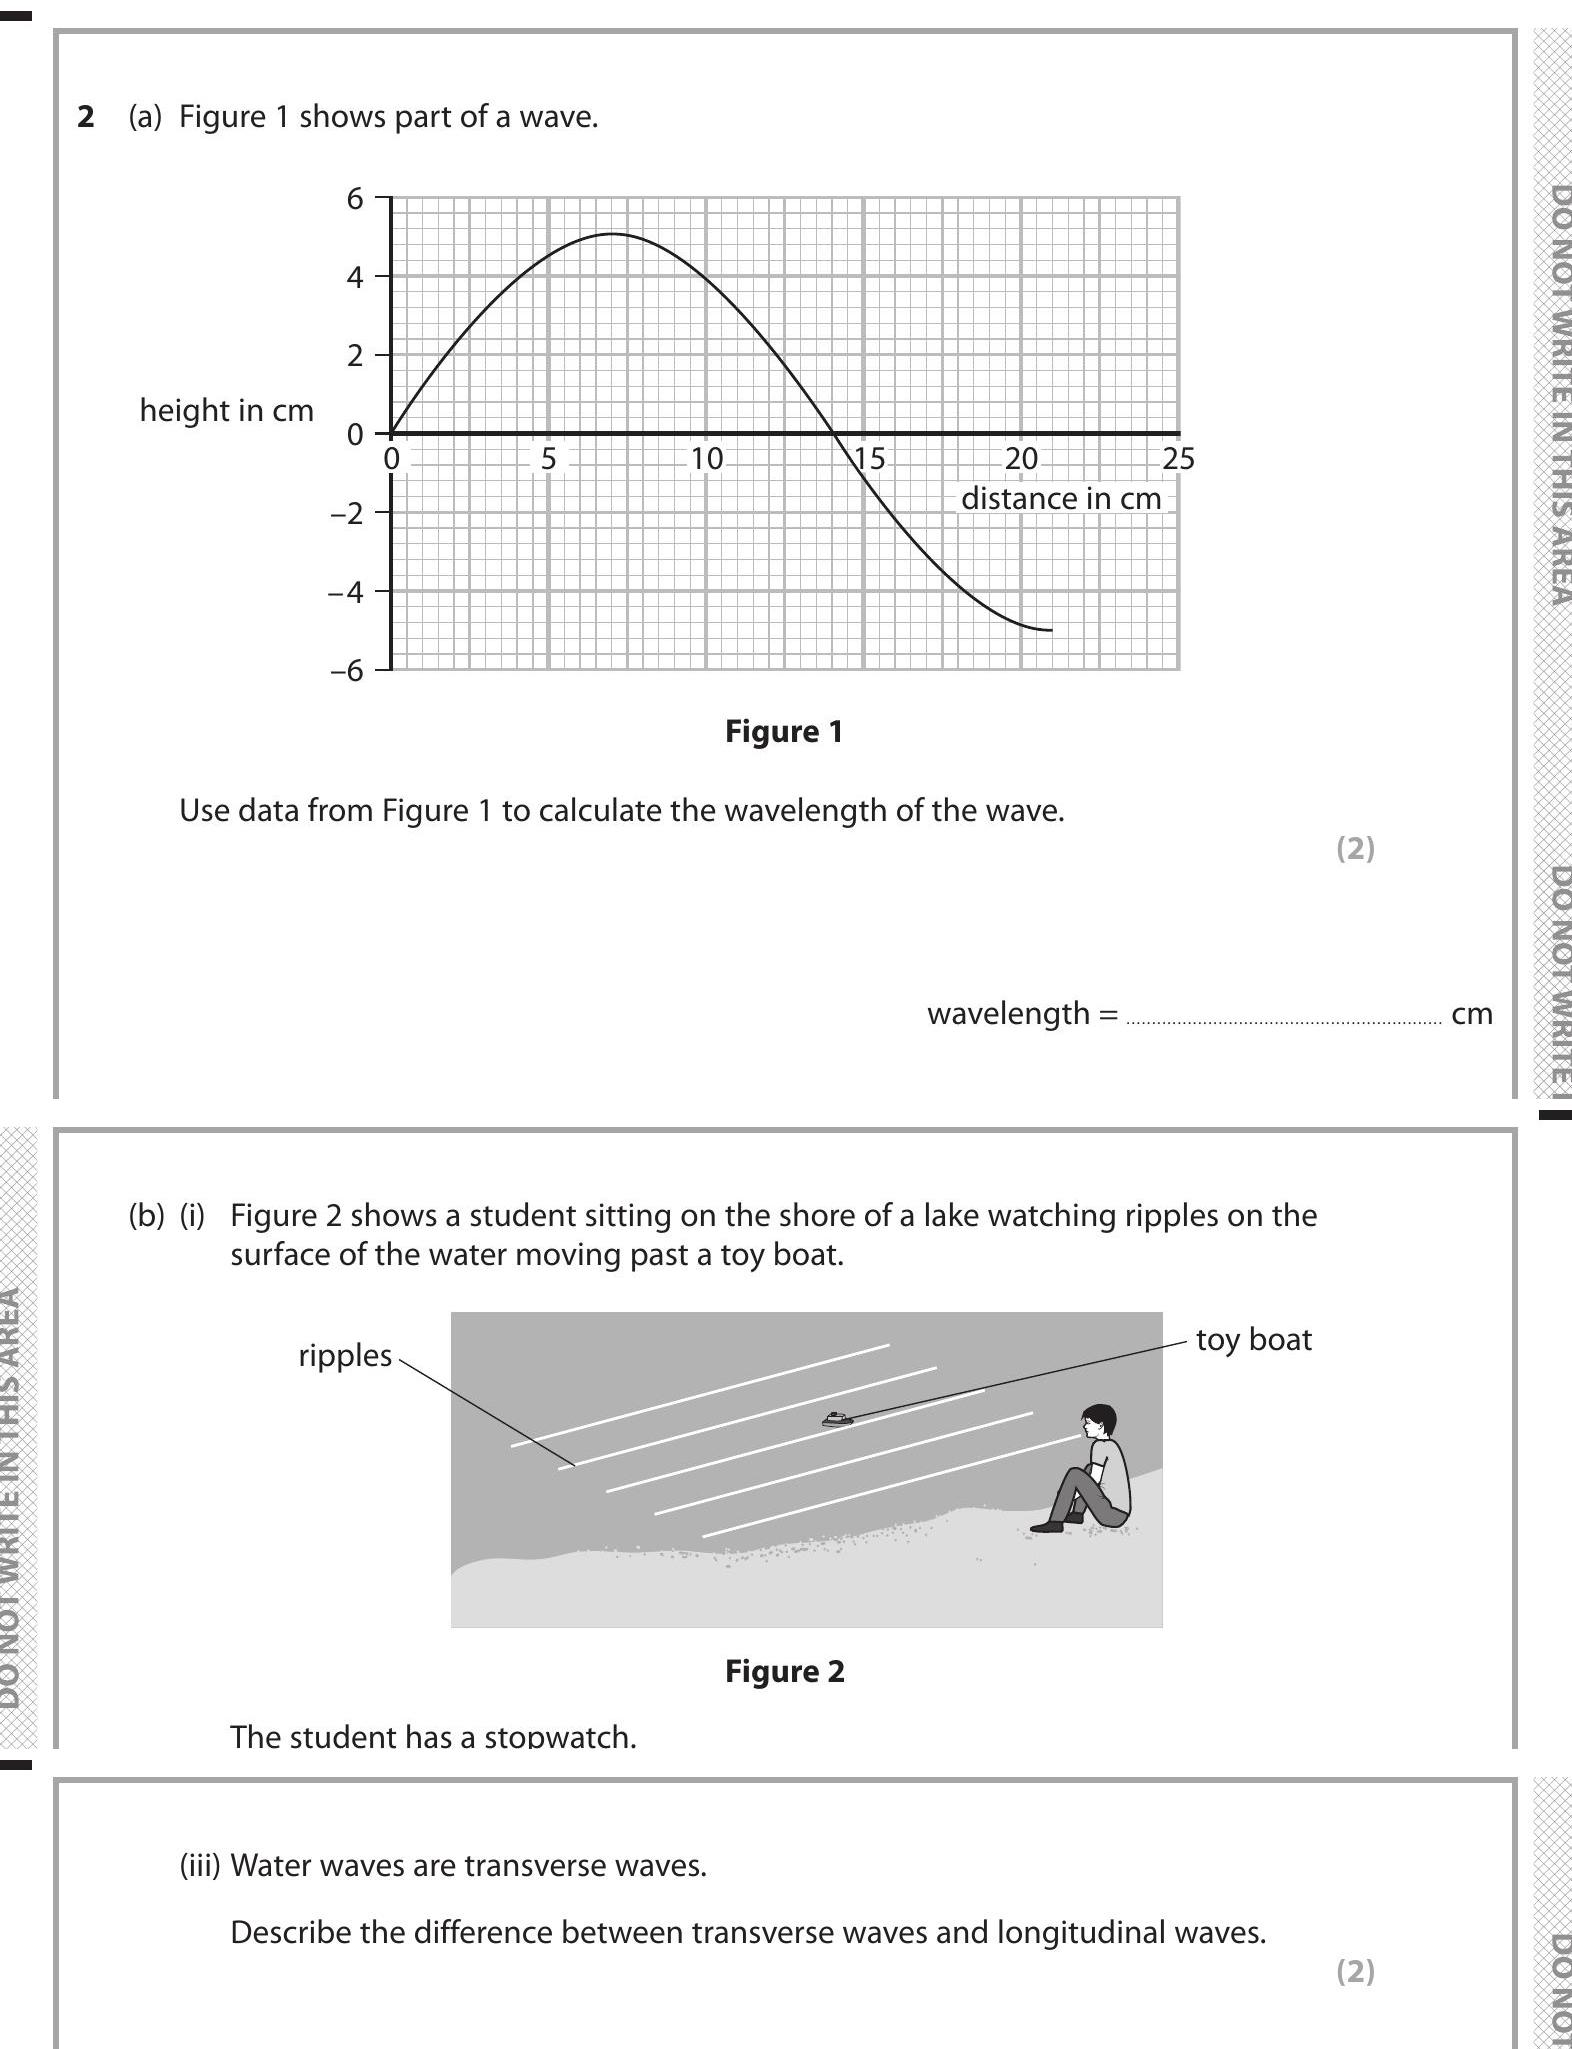
Use data from Figure 1 to calculate the wavelength of the wave.

Answer
To calculate the wavelength, observe the distance between two consecutive peaks (or troughs) on the graph in Figure 1. From the x-axis, measure the distance over which the wave completes one cycle (peak to peak). In this case, the wavelength measured from the graph is 28 cm.
Step 2
Describe the difference between transverse waves and longitudinal waves.
Answer
Transverse waves involve oscillations that are perpendicular to the direction of the wave's travel. In this type of wave, points move up and down or side to side, creating crests and troughs. In contrast, longitudinal waves feature oscillations that are in the same direction as the wave's travel. Here, particles move back and forth, creating compressions and rarefactions.