Photo AI
The graph in Figure 14 shows the variation in atmospheric pressure with the height above sea level - Edexcel - GCSE Physics - Question 7 - 2018 - Paper 1
Question 7
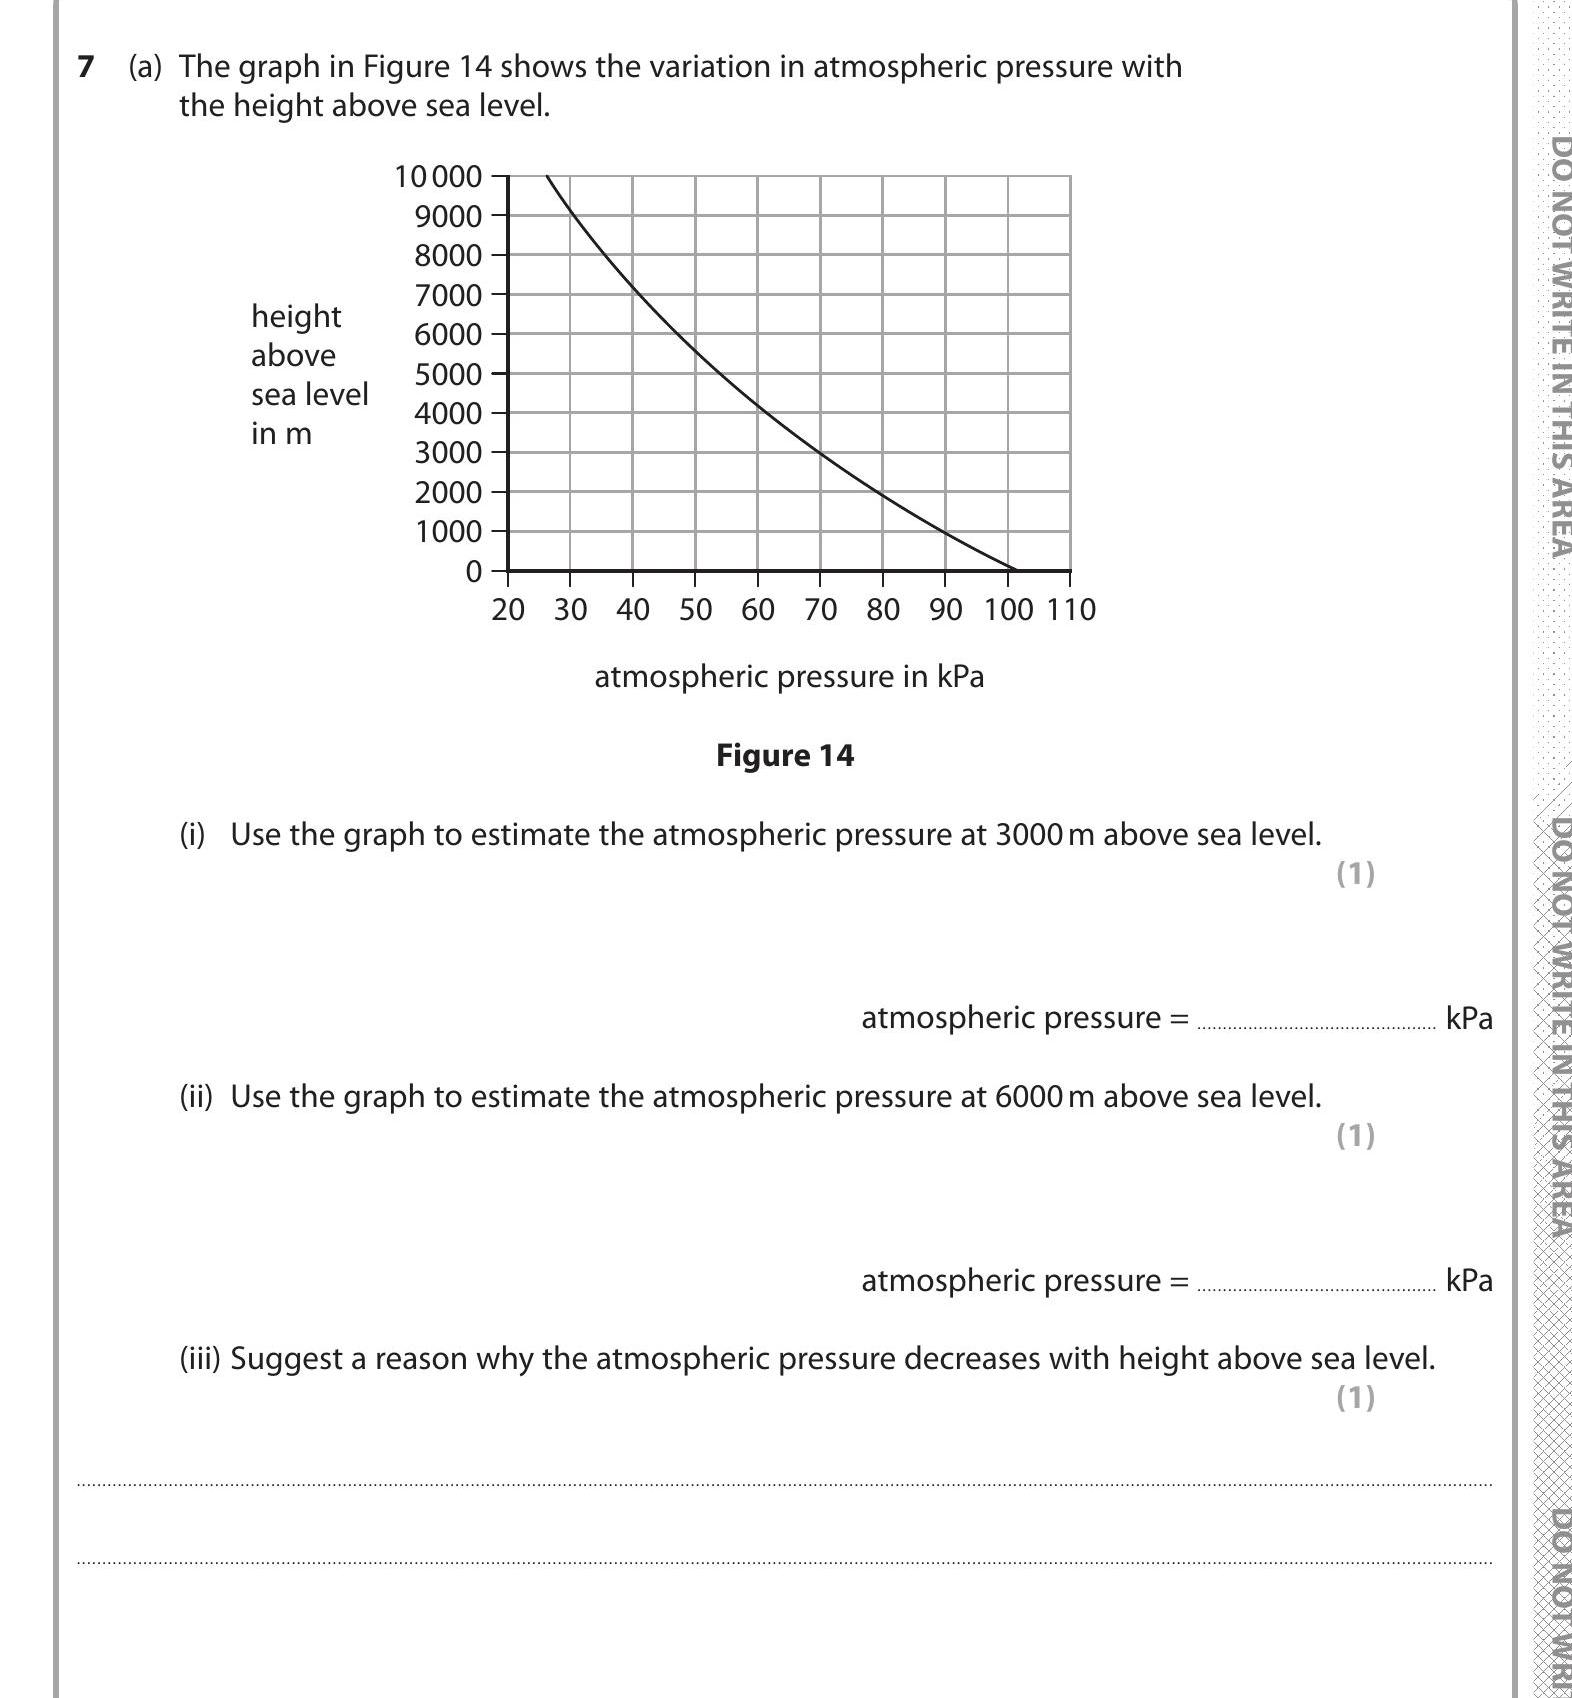
The graph in Figure 14 shows the variation in atmospheric pressure with the height above sea level. (i) Use the graph to estimate the atmospheric pressure at 3000 m... show full transcript
Worked Solution & Example Answer:The graph in Figure 14 shows the variation in atmospheric pressure with the height above sea level - Edexcel - GCSE Physics - Question 7 - 2018 - Paper 1
Step 1
Use the graph to estimate the atmospheric pressure at 3000 m above sea level.

Answer
To estimate the atmospheric pressure at 3000 m, locate 3000 m on the height axis of the graph. Following horizontally to the pressure curve and then down to the atmospheric pressure axis, we find that the atmospheric pressure is approximately 700 hPa (hectopascals).
Step 2
Use the graph to estimate the atmospheric pressure at 6000 m above sea level.
Answer
For the pressure at 6000 m, first find 6000 m on the height axis. Similar to the previous part, trace horizontally until reaching the pressure curve and then down to the atmospheric pressure axis. The estimated atmospheric pressure at 6000 m is about 500 hPa.
Step 3
Suggest a reason why the atmospheric pressure decreases with height above sea level.
Answer
As altitude increases, the atmosphere becomes less dense. This occurs because the weight of the air above exerts pressure on the air below, meaning that as you rise higher, there is less air above you to exert pressure. Therefore, the atmospheric pressure decreases with height.