The particles of a gas exert a pressure on the walls of a container - Edexcel - GCSE Physics - Question 4 - 2019 - Paper 1
Question 4
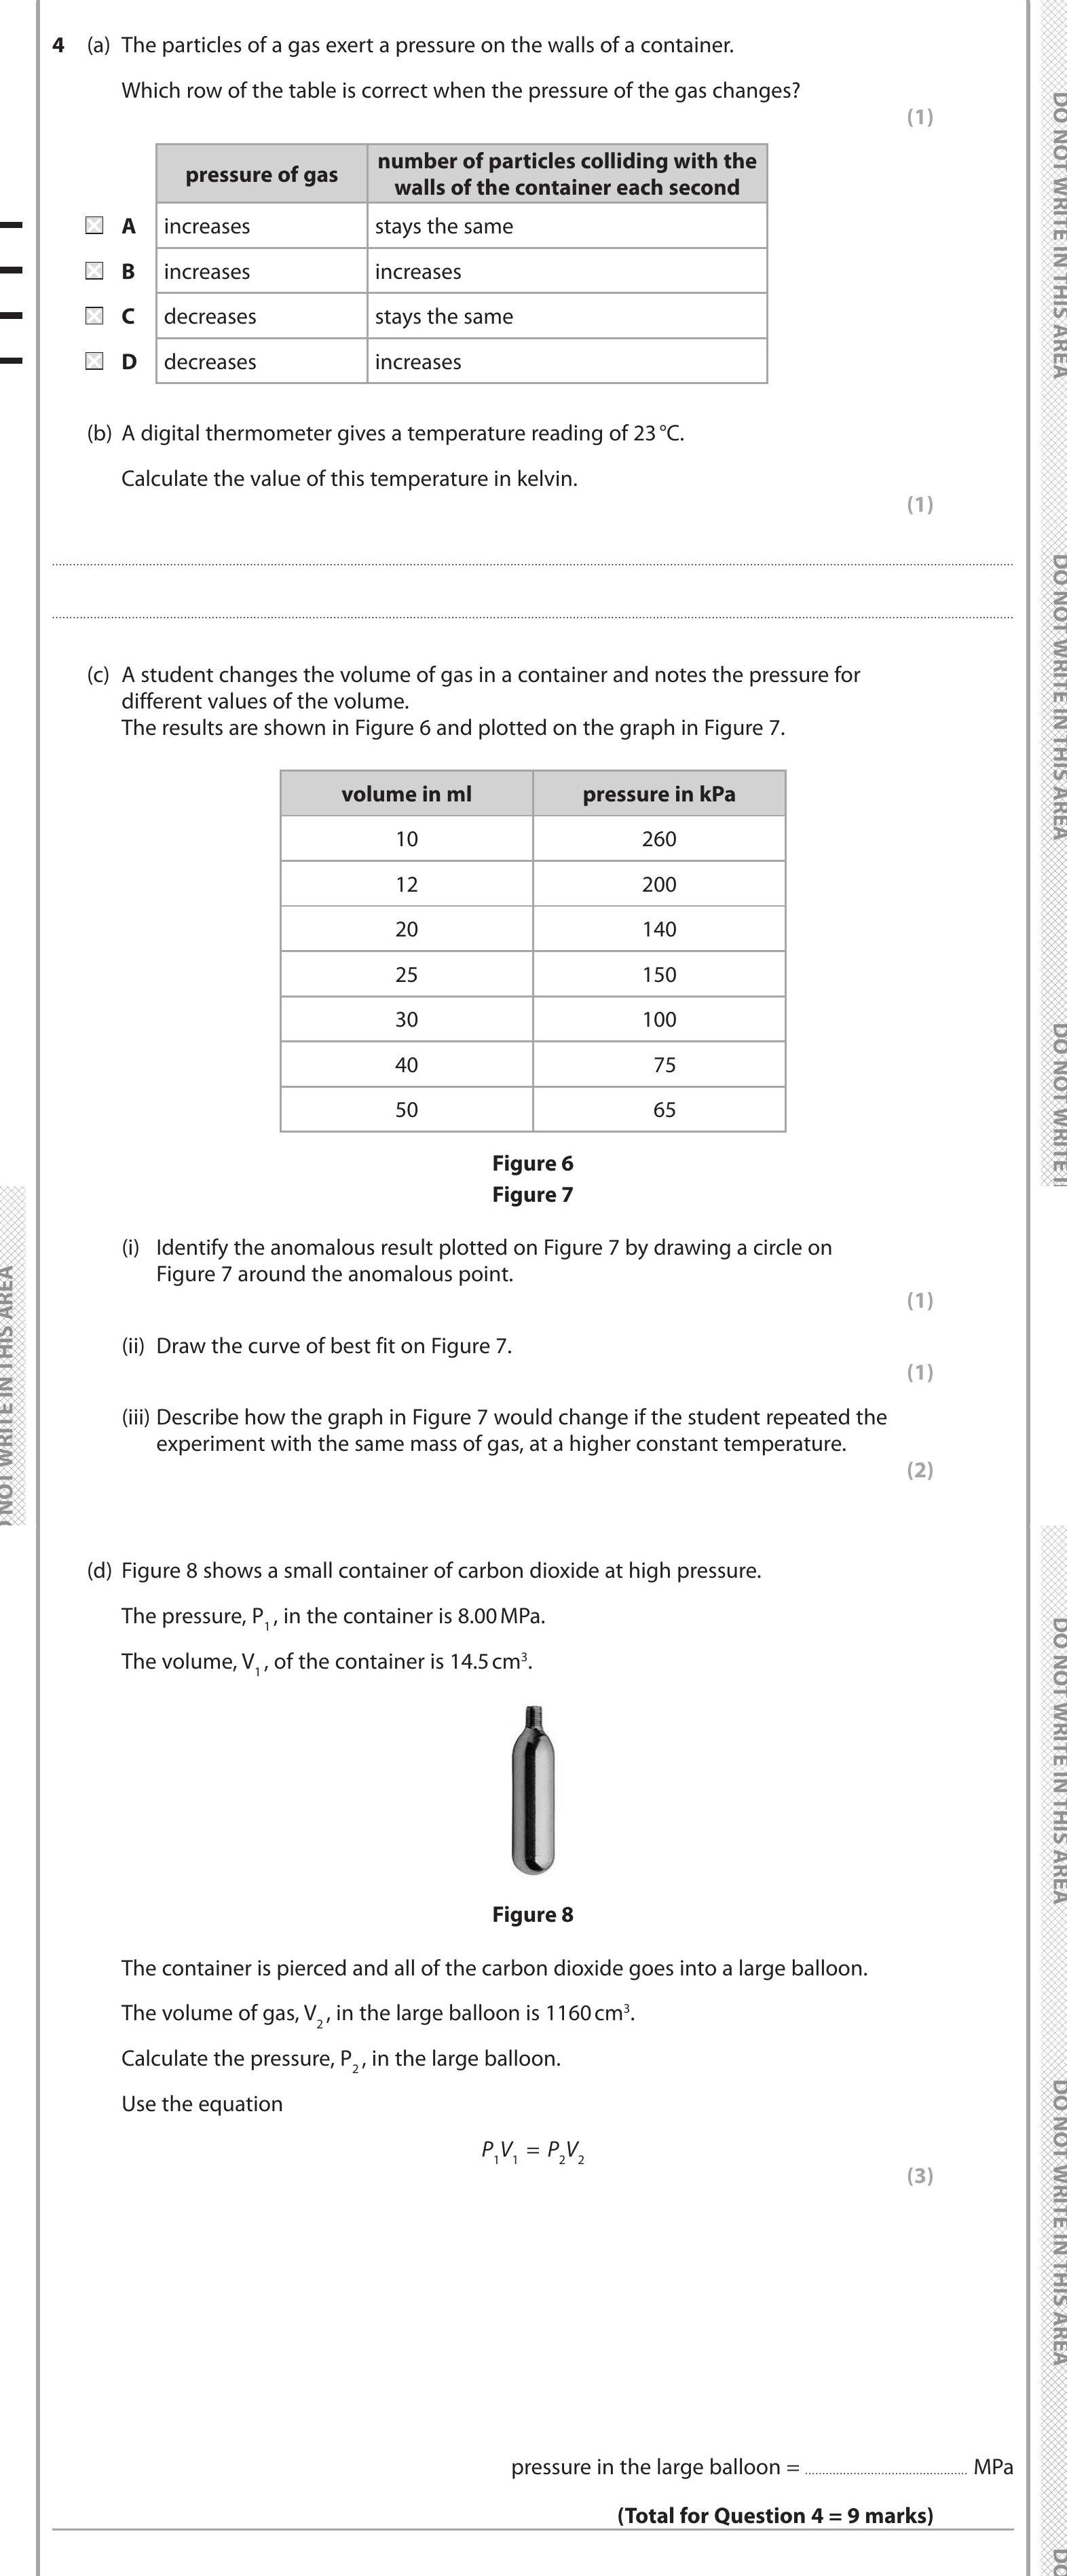
The particles of a gas exert a pressure on the walls of a container.
Which row of the table is correct when the pressure of the gas changes?
| pressure of gas | num... show full transcript
Worked Solution & Example Answer:The particles of a gas exert a pressure on the walls of a container - Edexcel - GCSE Physics - Question 4 - 2019 - Paper 1
Step 1
Which row of the table is correct when the pressure of the gas changes?
96%
114 rated
Only available for registered users.
Sign up now to view full answer, or log in if you already have an account!
Answer
The correct row is A: when the pressure of the gas increases, the number of particles colliding with the walls of the container each second also increases.
Step 2
Calculate the value of this temperature in kelvin.
99%
104 rated
Only available for registered users.
Sign up now to view full answer, or log in if you already have an account!
Answer
To convert Celsius to Kelvin, we use the formula:
K=°C+273.15
So, the temperature in Kelvin is:
K=23+273.15=296.15
Thus, the value is approximately 296 K.
Step 3
Identify the anomalous result plotted on Figure 7.
96%
101 rated
Only available for registered users.
Sign up now to view full answer, or log in if you already have an account!
Answer
The anomalous result can be identified at the data point for 12 ml and 200 kPa, which deviates from the trend.
Step 4
Draw the curve of best fit on Figure 7.
98%
120 rated
Only available for registered users.
Sign up now to view full answer, or log in if you already have an account!
Answer
The curve of best fit should touch as many points as possible without passing through the anomalous point, demonstrating the negative correlation between volume and pressure.
Step 5
Describe how the graph in Figure 7 would change if the student repeated the experiment.
97%
117 rated
Only available for registered users.
Sign up now to view full answer, or log in if you already have an account!
Answer
If the experiment were repeated with the same mass of gas at a higher temperature, the graph would shift upwards. Specifically, for the same volume, the pressure would be higher, leading to all points on the graph moving to a higher pressure value while maintaining a similar shape.
Step 6
Calculate the pressure, P₂, in the large balloon.
97%
121 rated
Only available for registered users.
Sign up now to view full answer, or log in if you already have an account!
Answer
Using the equation, we have:
P1V1=P2V2
Substituting the known values:
8.00extMPaimes14.5extcm3=P2imes1160extcm3
Solving for P₂:
P₂ = rac{8.00 imes 14.5}{1160}
Calculating gives us:
P2ext≈0.1MPa
Thus, the pressure in the large balloon is approximately 0.1 MPa.