1. The chart shows the electromagnetic spectrum - Edexcel - GCSE Physics - Question 1 - 2012 - Paper 1
Question 1
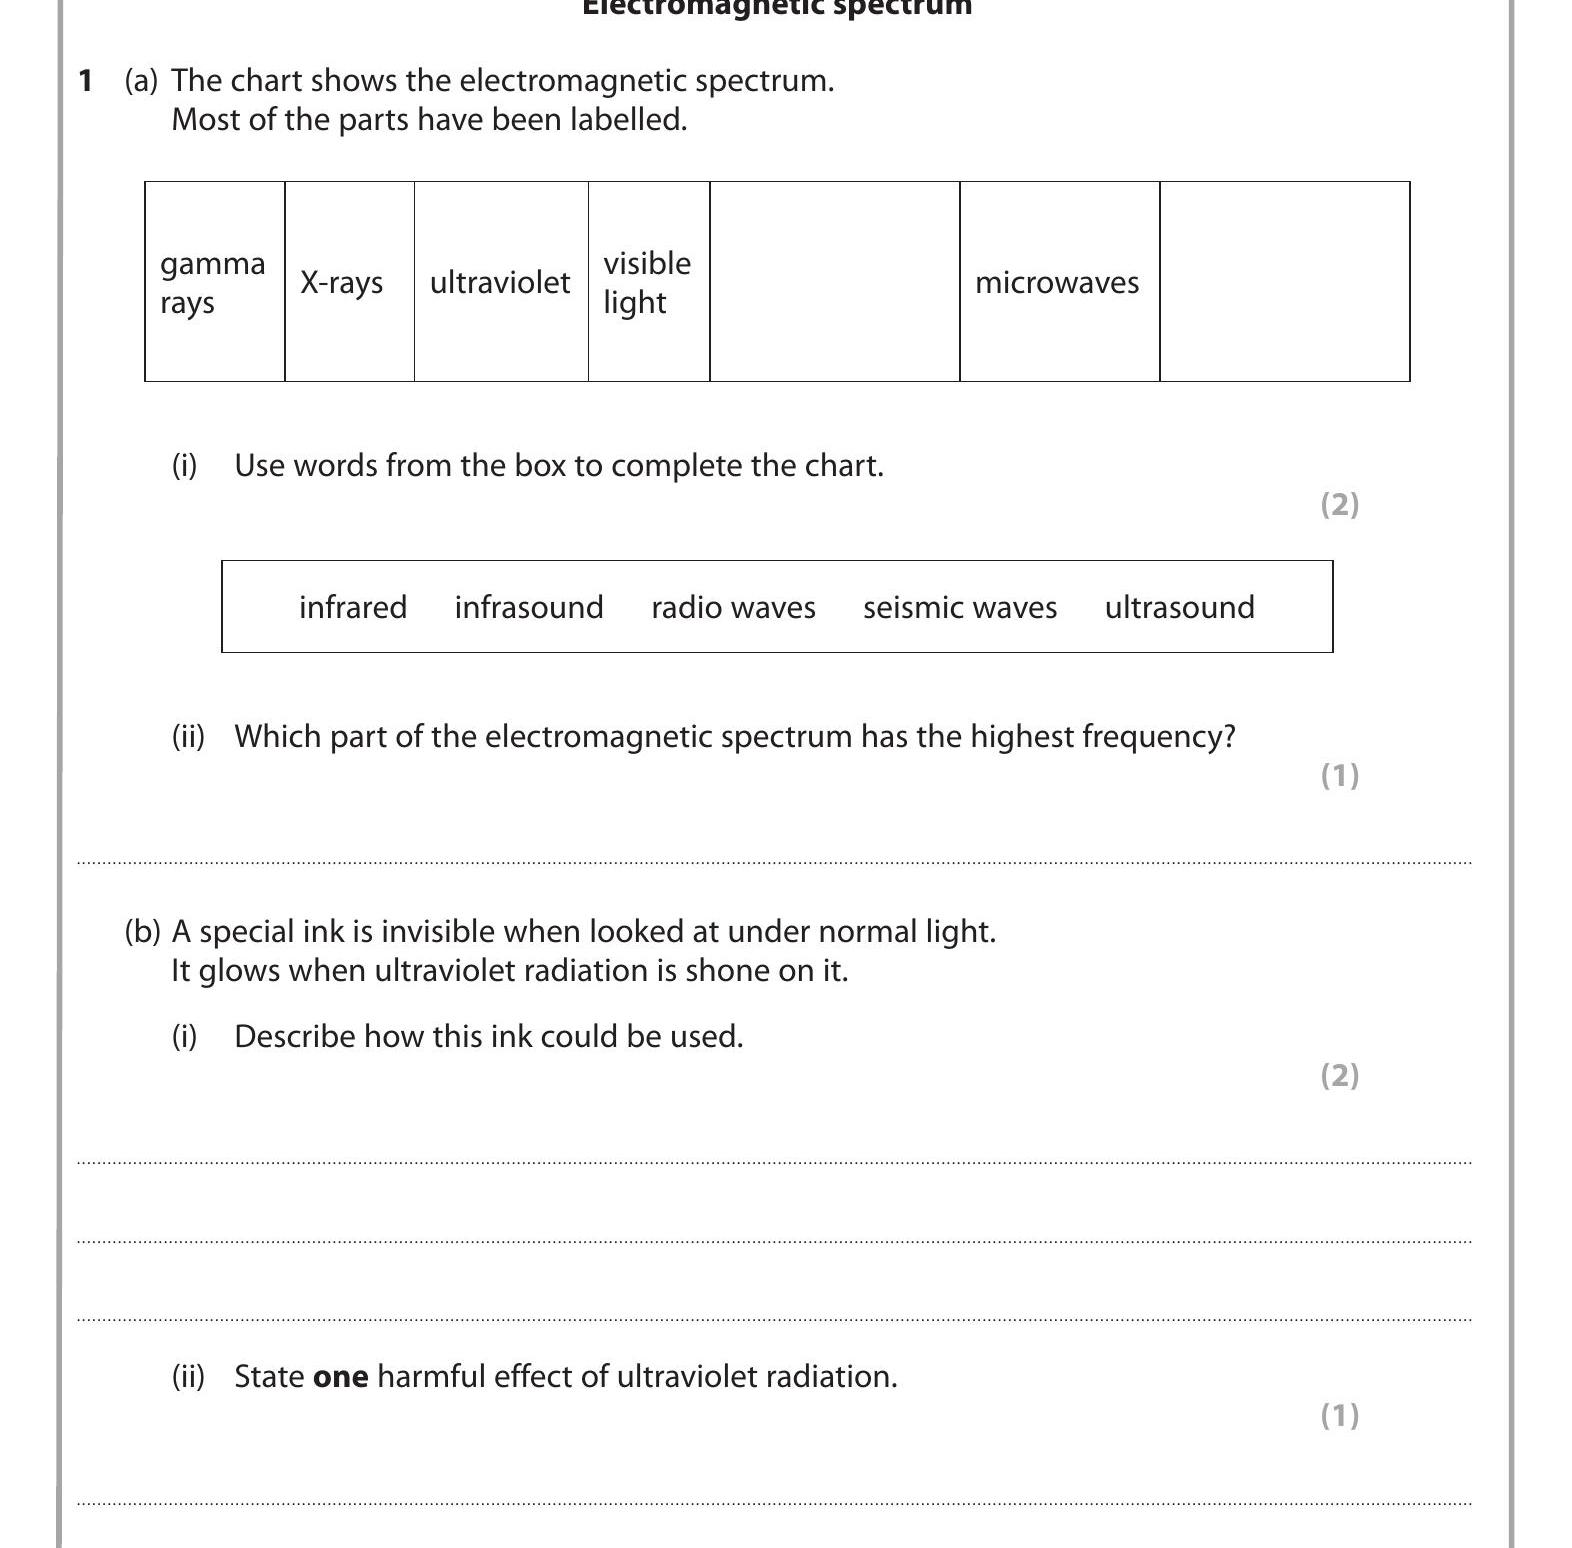
1. The chart shows the electromagnetic spectrum.
Most of the parts have been labelled.
gamma rays X-rays ultraviolet visible light microwaves
(i) Use words from th... show full transcript
Worked Solution & Example Answer:1. The chart shows the electromagnetic spectrum - Edexcel - GCSE Physics - Question 1 - 2012 - Paper 1
Step 1
Use words from the box to complete the chart.
96%
114 rated
Only available for registered users.
Sign up now to view full answer, or log in if you already have an account!
Answer
The two words to complete the chart are:
Infrared for the region between gamma rays and visible light.
Radio waves for the region between visible light and microwaves.
Step 2
Which part of the electromagnetic spectrum has the highest frequency?
99%
104 rated
Only available for registered users.
Sign up now to view full answer, or log in if you already have an account!
Answer
Gamma rays have the highest frequency in the electromagnetic spectrum.
Step 3
Describe how this ink could be used.
96%
101 rated
Only available for registered users.
Sign up now to view full answer, or log in if you already have an account!
Answer
This special ink could be used on documents or items to assist in identification if stolen. For instance, it can be used on banknotes to help identify forgeries or on items where ownership needs to be established.
Step 4
State one harmful effect of ultraviolet radiation.
98%
120 rated
Only available for registered users.
Sign up now to view full answer, or log in if you already have an account!
Answer
One harmful effect of ultraviolet radiation is that it can cause skin cancer due to its ability to damage the DNA in skin cells.