Here is the velocity-time graph for a car for the first 20 s of a journey - Edexcel - GCSE Physics - Question 5 - 2013 - Paper 1
Question 5
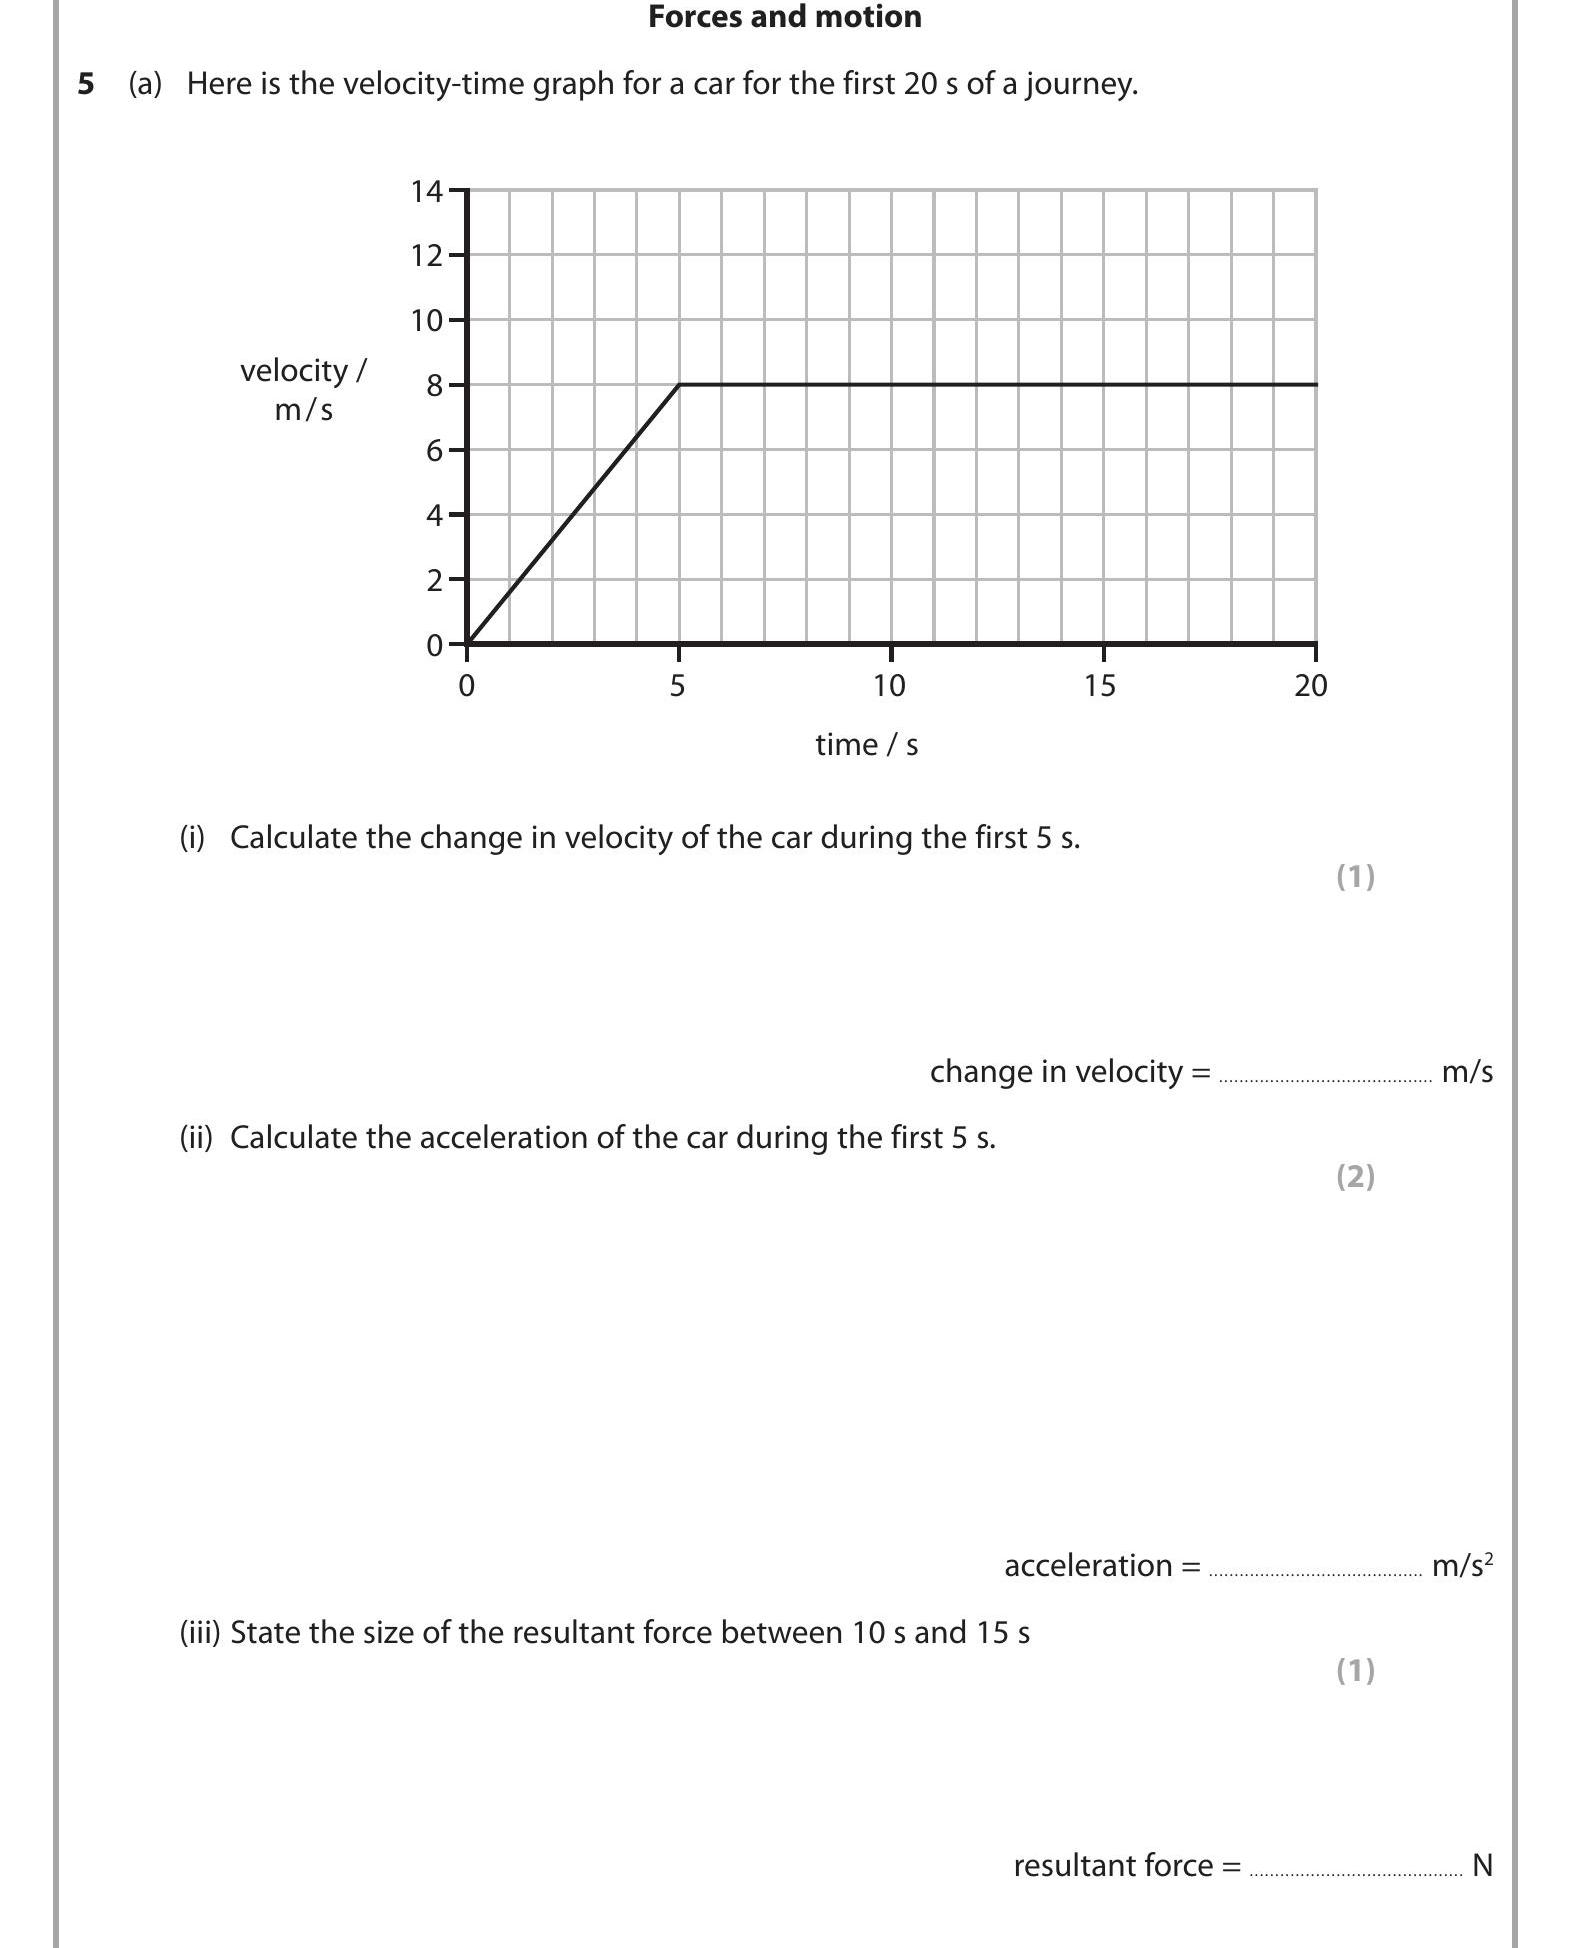
Here is the velocity-time graph for a car for the first 20 s of a journey.
(i) Calculate the change in velocity of the car during the first 5 s.
(ii) Calculate the... show full transcript
Worked Solution & Example Answer:Here is the velocity-time graph for a car for the first 20 s of a journey - Edexcel - GCSE Physics - Question 5 - 2013 - Paper 1
Step 1
Calculate the change in velocity of the car during the first 5 s.
96%
114 rated
Only available for registered users.
Sign up now to view full answer, or log in if you already have an account!
Answer
To find the change in velocity during the first 5 seconds, we read the graph. At 0s, the velocity is 0 m/s, and at 5s, the velocity reaches 8 m/s. Thus, the change in velocity can be calculated as:
Change in velocity=Final velocity−Initial velocity=8 m/s−0 m/s=8 m/s
Step 2
Calculate the acceleration of the car during the first 5 s.
99%
104 rated
Only available for registered users.
Sign up now to view full answer, or log in if you already have an account!
Answer
Acceleration is defined as the change in velocity over time. Using the change in velocity found in part (i) and the time interval of 5 seconds:
Acceleration=TimeChange in velocity=5 s8 m/s=1.6 m/s2
Step 3
State the size of the resultant force between 10 s and 15 s.
96%
101 rated
Only available for registered users.
Sign up now to view full answer, or log in if you already have an account!
Answer
From the graph, we see that between 10 s and 15 s, the velocity remains constant at 12 m/s. Thus, the acceleration is 0 m/s², which implies that the resultant force acting on the car is also 0 N due to: