The diagram shows a phylogenetic tree produced using DNA analysis - OCR Gateway - GCSE Biology Combined Science - Question 6 - 2021 - Paper 1
Question 6
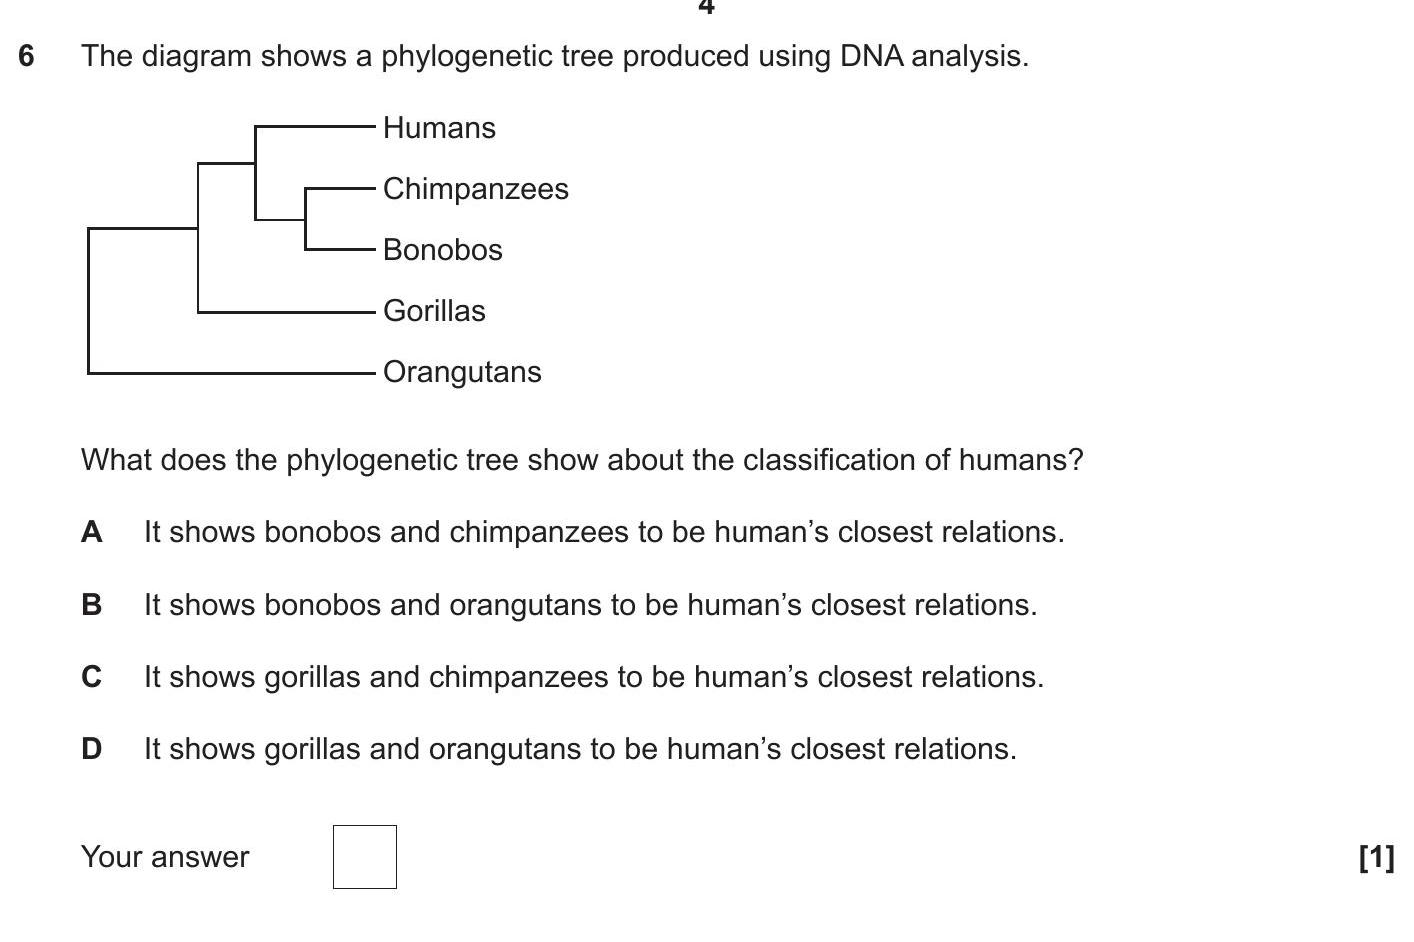
The diagram shows a phylogenetic tree produced using DNA analysis.
The diagram shows a phylogenetic tree produced using DNA analysis.
What does the phylogenetic tr... show full transcript
Worked Solution & Example Answer:The diagram shows a phylogenetic tree produced using DNA analysis - OCR Gateway - GCSE Biology Combined Science - Question 6 - 2021 - Paper 1
Step 1
A) It shows bonobos and chimpanzees to be human’s closest relations.
96%
114 rated
Only available for registered users.
Sign up now to view full answer, or log in if you already have an account!
Answer
This statement is supported by the diagram, as it indicates that bonobos and chimpanzees have a more recent common ancestor with humans compared to the other primates.
Step 2
B) It shows bonobos and orangutans to be human’s closest relations.
99%
104 rated
Only available for registered users.
Sign up now to view full answer, or log in if you already have an account!
Answer
This statement is incorrect as orangutans are not depicted as close relatives of humans in the phylogenetic tree.
Step 3
C) It shows gorillas and chimpanzees to be human’s closest relations.
96%
101 rated
Only available for registered users.
Sign up now to view full answer, or log in if you already have an account!
Answer
This statement is also incorrect because the tree shows that bonobos and chimpanzees share a closer link to humans than gorillas.
Step 4
D) It shows gorillas and orangutans to be human’s closest relations.
98%
120 rated
Only available for registered users.
Sign up now to view full answer, or log in if you already have an account!
Answer
This statement is incorrect since gorillas and orangutans are shown to be more distantly related to humans in the phylogenetic tree.