Photo AI
This graph shows part of Lucy's car journey from London to Sheffield - OCR - GCSE Maths - Question 13 - 2017 - Paper 1
Question 13
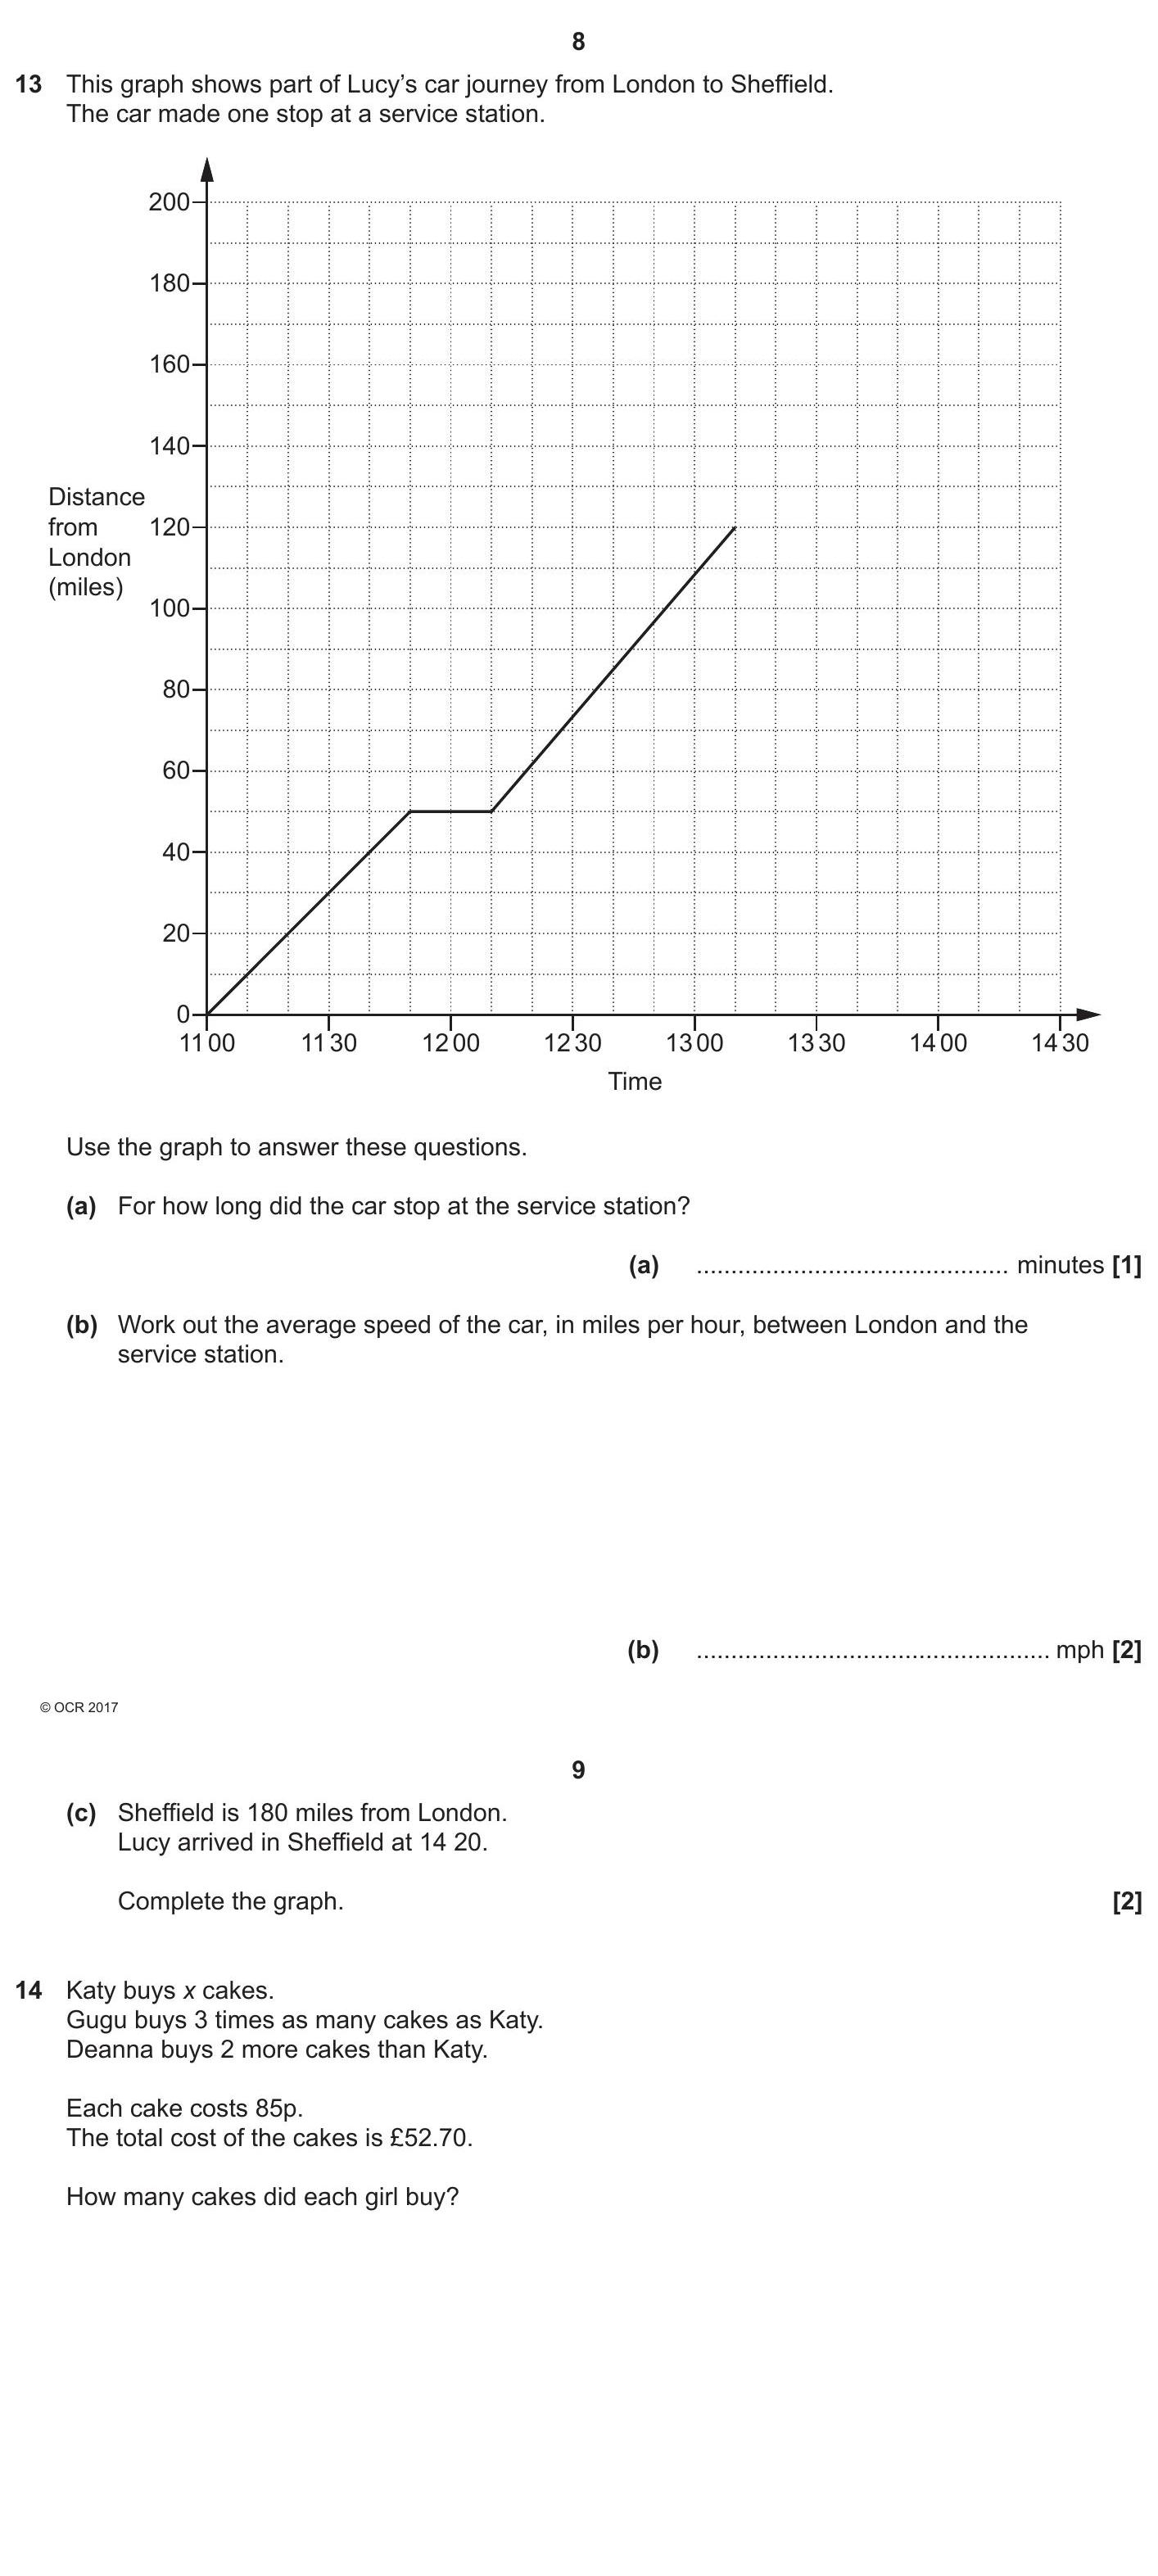
This graph shows part of Lucy's car journey from London to Sheffield. The car made one stop at a service station. Use the graph to answer these questions. (a) For ... show full transcript
Worked Solution & Example Answer:This graph shows part of Lucy's car journey from London to Sheffield - OCR - GCSE Maths - Question 13 - 2017 - Paper 1
Step 1

Step 2
Work out the average speed of the car, in miles per hour, between London and the service station.
Answer
To find the average speed, we first need the distance covered. From the graph, the distance from London to the service station is 50 miles, and the time taken is from 11:00 to 13:10, which is 2 hours and 10 minutes (or 2.17 hours).
Average speed is calculated using the formula:
ext{Average Speed} = rac{ ext{Distance}}{ ext{Time}} = rac{50 ext{ miles}}{2.17 ext{ hours}} \ ext{Average Speed} ≈ 23.06 ext{ mph}.Step 3
Complete the graph.
Answer
To complete the graph, we need to plot the line representing Lucy's journey from London (0 miles at 11:00) to the service station (50 miles at 13:10) and then continue the line to represent the journey from the service station to Sheffield (180 miles) based on the arrival time of 14:20.