Photo AI
The box plot shows the distribution of the runs scored by David in some cricket matches - OCR - GCSE Maths - Question 15 - 2018 - Paper 4
Question 15
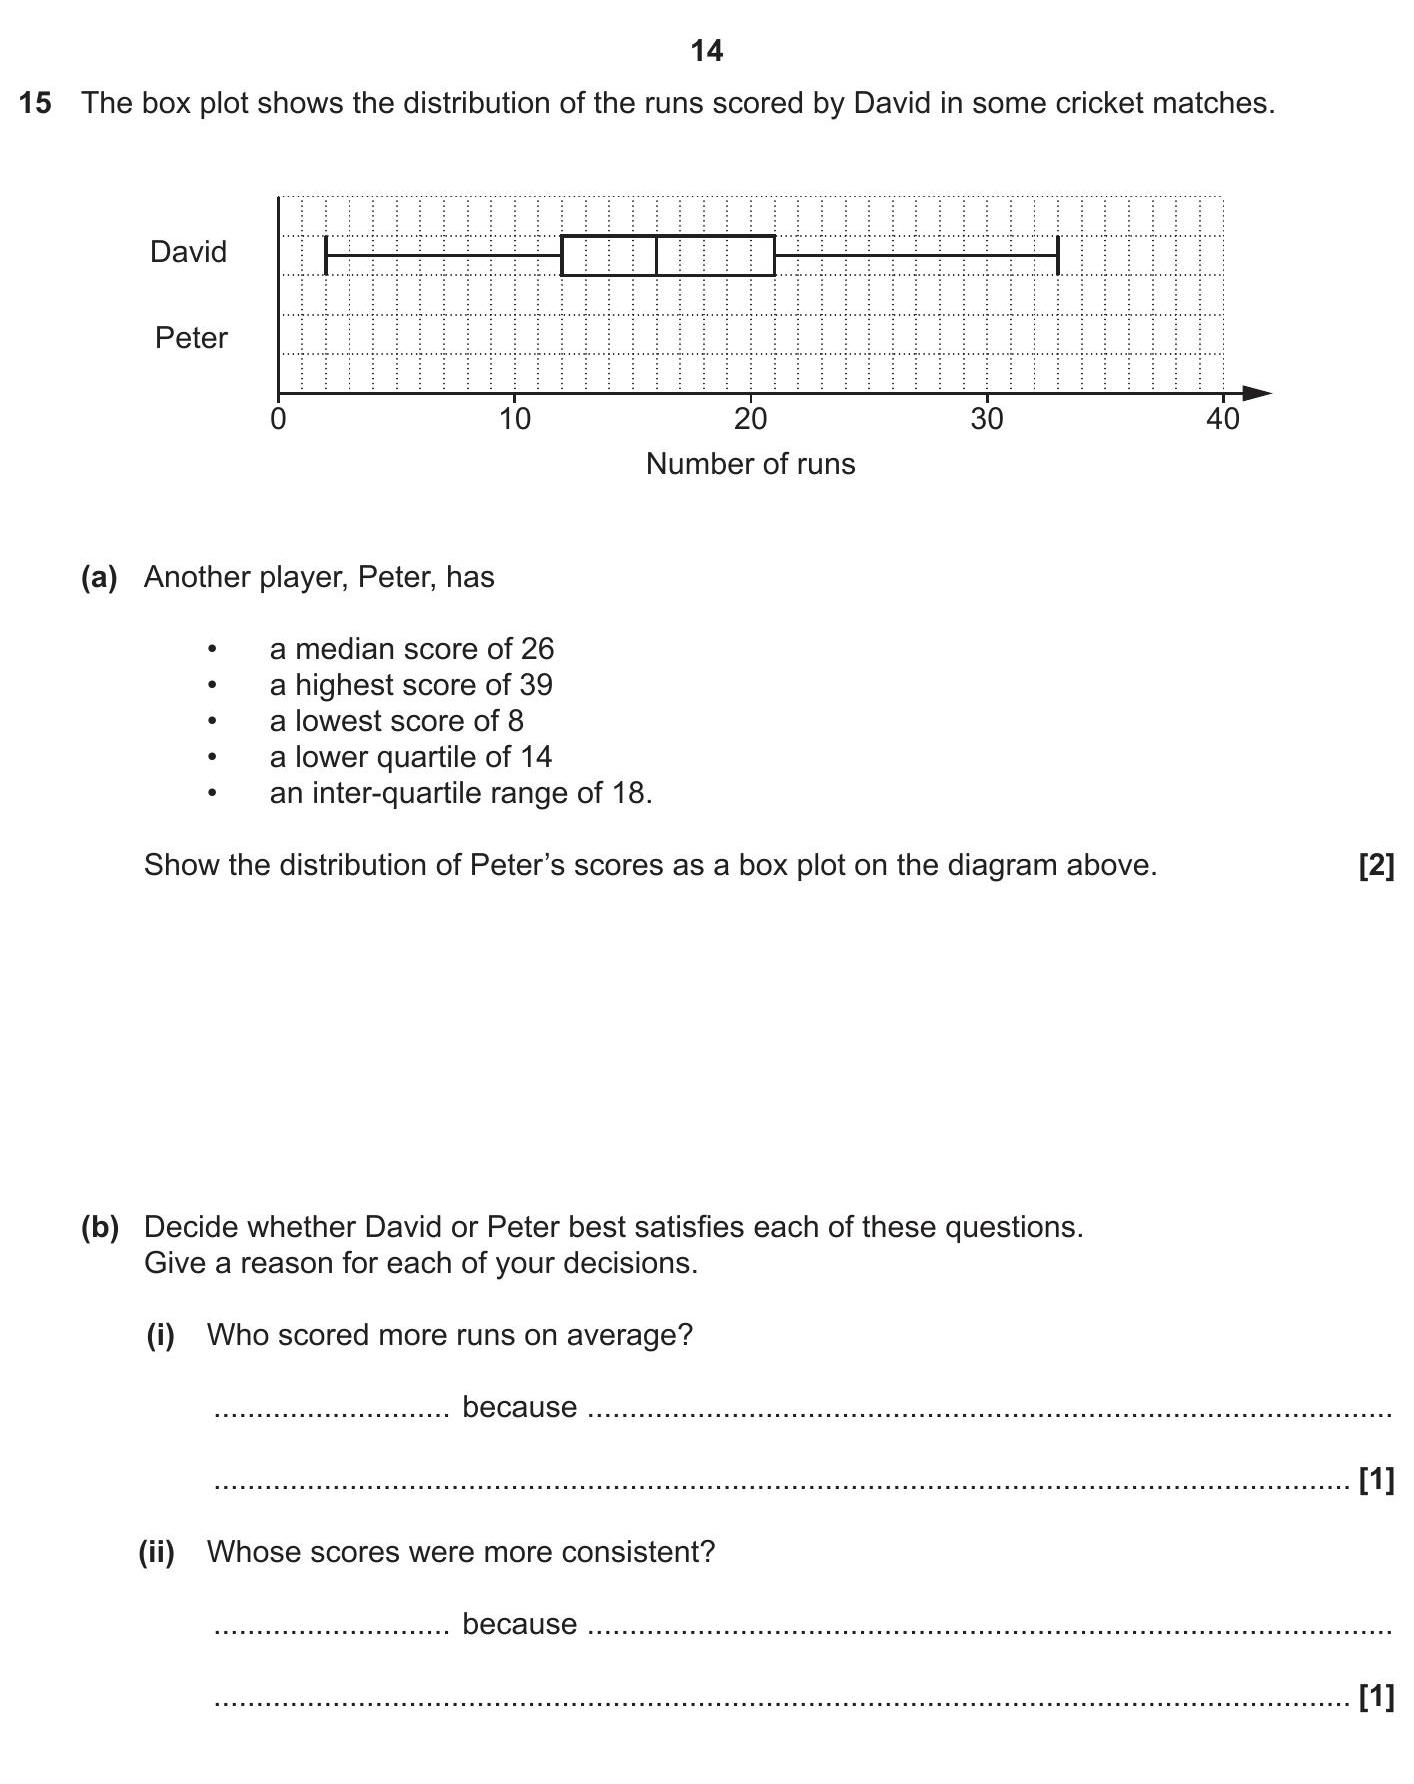
The box plot shows the distribution of the runs scored by David in some cricket matches. Another player, Peter, has - a median score of 26 - a highest score of 39 -... show full transcript
Worked Solution & Example Answer:The box plot shows the distribution of the runs scored by David in some cricket matches - OCR - GCSE Maths - Question 15 - 2018 - Paper 4
Step 1
Show the distribution of Peter's scores as a box plot on the diagram above.

Answer
To illustrate Peter's scores as a box plot on the given diagram, we will identify the key values needed to construct the box plot:
- Lowest Score: 8
- Lower Quartile (Q1): 14
- Median: 26
- Upper Quartile (Q3): We can calculate Q3 using the inter-quartile range (IQR), which is 18. Thus, Q3 = Q1 + IQR = 14 + 18 = 32.
- Highest Score: 39
Using these values, we can draw the box plot:
- Mark the lowest score at 8 on the number line.
- Draw a box from 14 (Q1) to 32 (Q3).
- Draw a line inside the box at 26 (the median).
- Extend the whiskers from the left side of the box down to 8 and from the right side of the box to 39.
This box plot visually represents Peter's score distribution in relation to David's scores.
Step 2
Decide whether David or Peter best satisfies each of these questions. Give a reason for each of your decisions. (i) Who scored more runs on average?
Answer
Peter scored more runs on average because his median score is 26, which is higher than David's median score. A higher median indicates that more of Peter's scores are above the midpoint compared to David's.
Step 3
Decide whether David or Peter best satisfies each of these questions. Give a reason for each of your decisions. (ii) Whose scores were more consistent?
Answer
David's scores were more consistent because he has a smaller inter-quartile range (IQR) compared to Peter. A smaller IQR indicates that the scores are closer together, signifying less variability.