Complete this table for $y = x^2 + x - 4$ - OCR - GCSE Maths - Question 5 - 2017 - Paper 1

Question 5
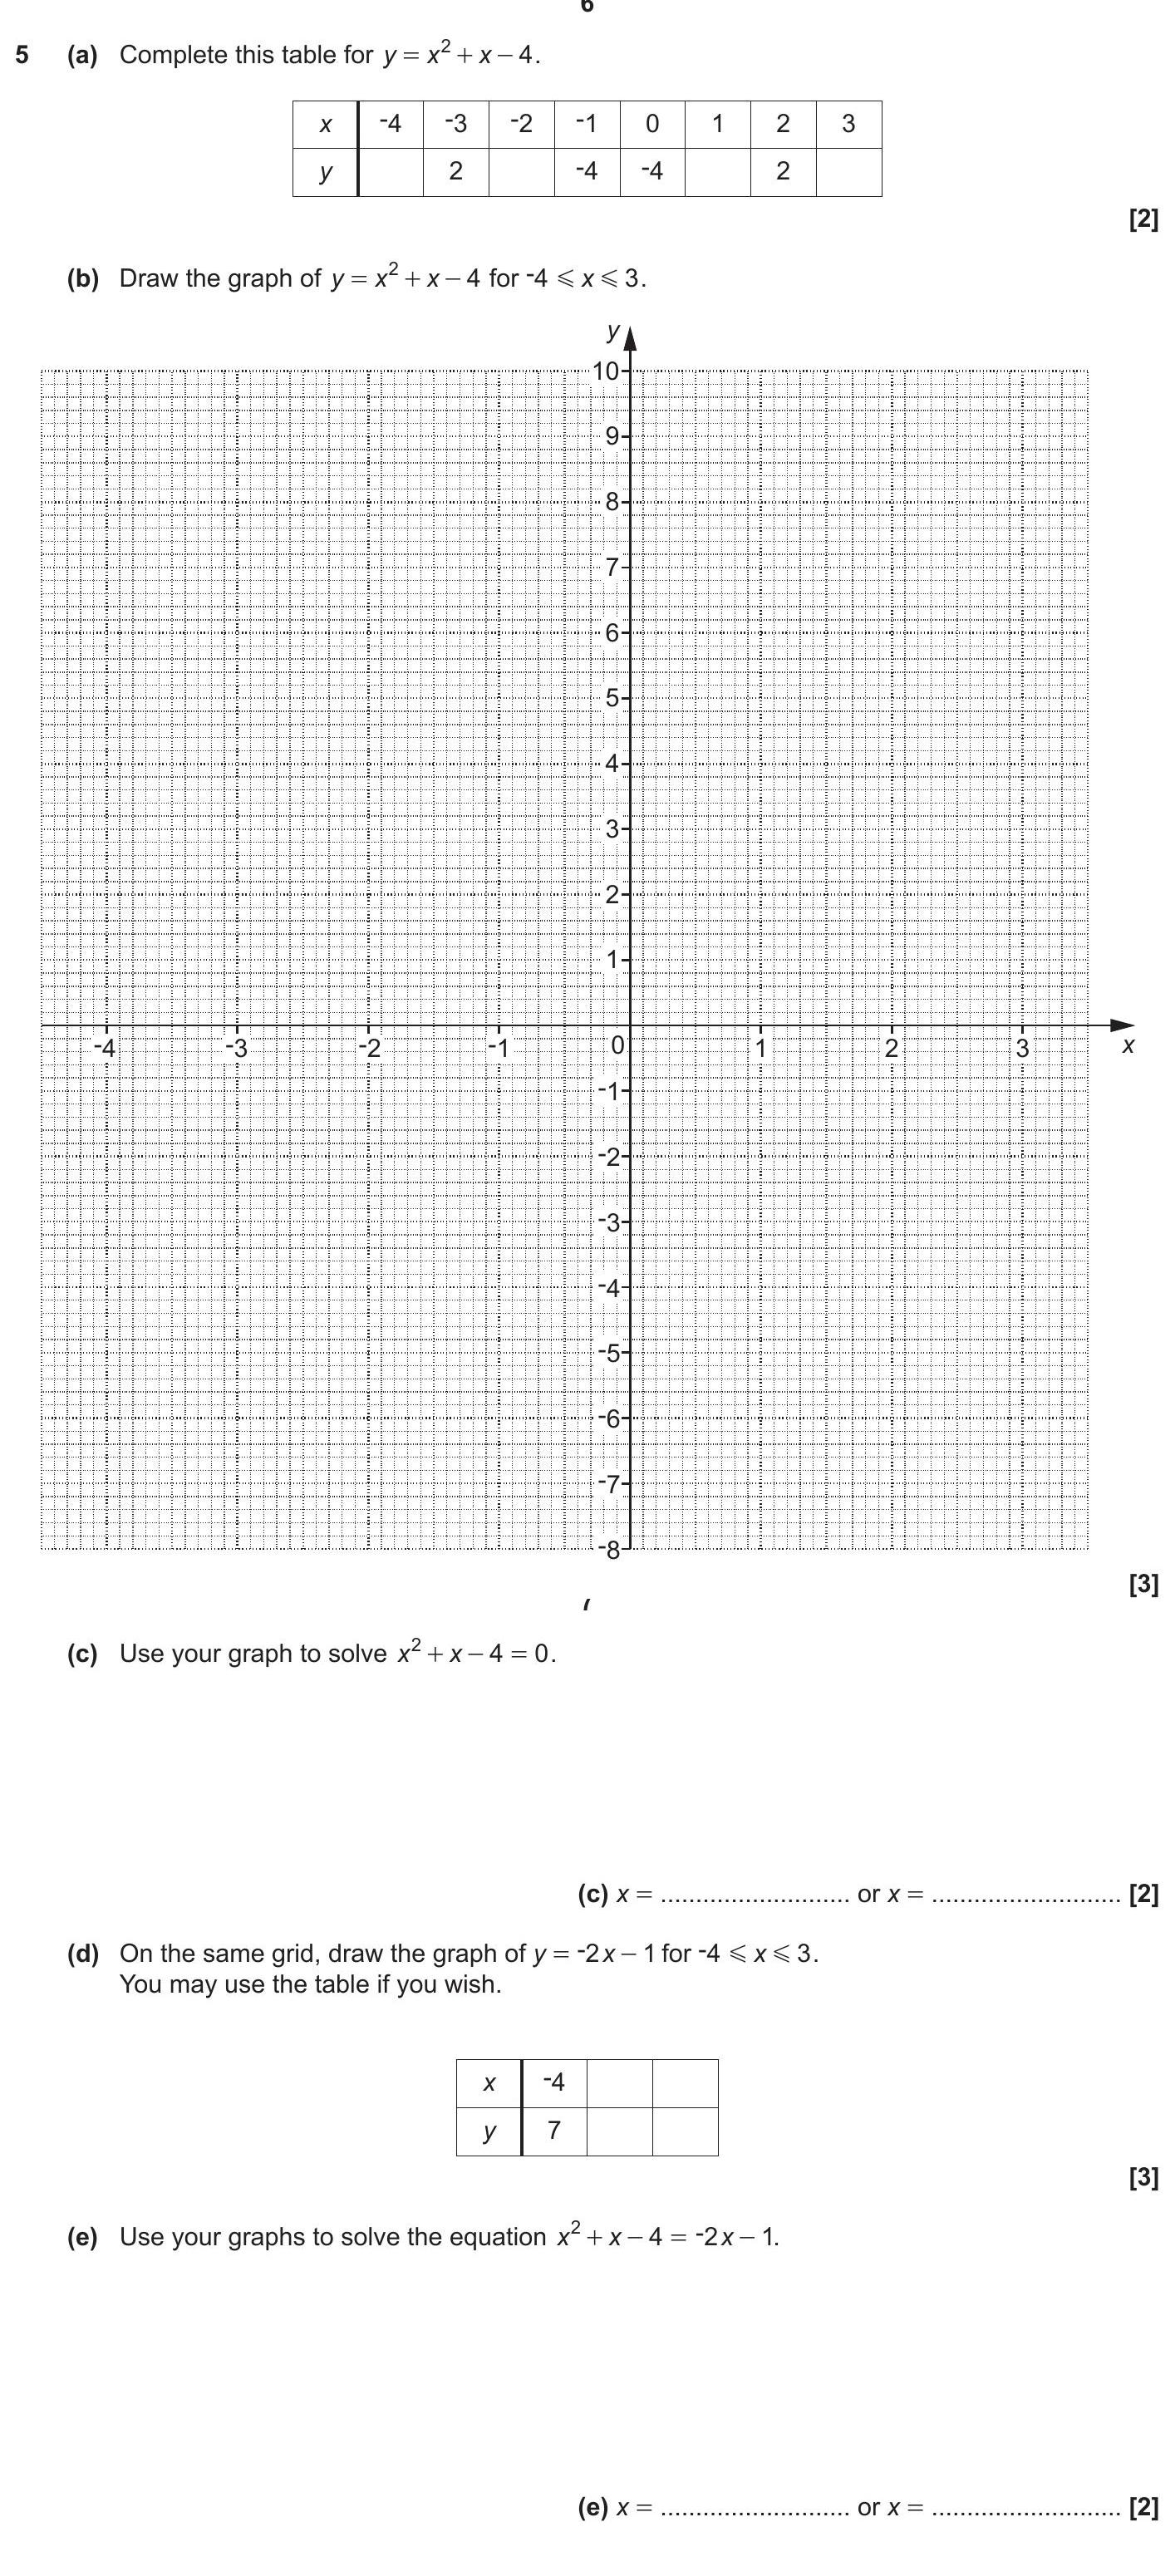
Complete this table for $y = x^2 + x - 4$.
| $x$ | -4 | -3 | -2 | -1 | 0 | 1 | 2 | 3 |
|-------|------|------|------|------|-----|-----|-----|--... show full transcript
Worked Solution & Example Answer:Complete this table for $y = x^2 + x - 4$ - OCR - GCSE Maths - Question 5 - 2017 - Paper 1
Complete this table for $y = x^2 + x - 4$

Only available for registered users.
Sign up now to view full answer, or log in if you already have an account!
To complete the table, substitute each value of x into the equation y=x2+x−4:
-
For x=−4:
y=(−4)2+(−4)−4=16−4−4=8
Thus, y=8.
-
For x=−3:
y=(−3)2+(−3)−4=9−3−4=2
Thus, y=2.
-
For x=−2:
y=(−2)2+(−2)−4=4−2−4=−2
Thus, y=−2.
-
For x=−1:
y=(−1)2+(−1)−4=1−1−4=−4
Thus, y=−4.
-
For x=0:
y=02+0−4=−4
Thus, y=−4.
-
For x=1:
y=12+1−4=1+1−4=−2
Thus, y=−2.
-
For x=2:
y=22+2−4=4+2−4=2
Thus, y=2.
-
For x=3:
y=32+3−4=9+3−4=8
Thus, y=8.
The completed table is:
| x | -4 | -3 | -2 | -1 | 0 | 1 | 2 | 3 |
|---|
| y | 8 | 2 | -2 | -4 | -4 | -2 | 2 | 8 |
Draw the graph of $y = x^2 + x - 4$ for $-4 < x < 3$
Only available for registered users.
Sign up now to view full answer, or log in if you already have an account!
To draw the graph:
- Plot the points from the completed table on a graph.
- The points to plot are:
- (-4, 8)
- (-3, 2)
- (-2, -2)
- (-1, -4)
- (0, -4)
- (1, -2)
- (2, 2)
- (3, 8)
- Connect the points to form a parabolic curve, opening upwards, representing the function y=x2+x−4.
- Make sure the graph is labeled with appropriate scales.
Use your graph to solve $x^2 + x - 4 = 0$
Only available for registered users.
Sign up now to view full answer, or log in if you already have an account!
To solve x2+x−4=0 using the graph:
- Identify the points where the graph intersects the x-axis.
- From the graph, the intersection points can be found approximately, which represent the solutions of the equation.
- Let's assume these points intersect at roughly xextvalues=1.5 and xextvalues=−3.5.
- Hence, the solutions are approximately xextvaluesextare1.5 or −3.5.
On the same grid, draw the graph of $y = -2x - 1$ for $-4 < x < 3$
Only available for registered users.
Sign up now to view full answer, or log in if you already have an account!
To draw the graph of y=−2x−1:
- Create a table for x values in the range of −4 to 3.
- Calculate y for various x values:
- For x=−4, y=−2(−4)−1=7
- For x=−3, y=−2(−3)−1=5
- For x=−2, y=−2(−2)−1=3
- For x=−1, y=−2(−1)−1=1
- For x=0, y=−1
- For x=1, y=−3
- For x=2, y=−5
- For x=3, y=−7
- Plot the points on the same grid as the parabola.
- Connect the points with a straight line.
Use your graphs to solve the equation $x^2 + x - 4 = -2x - 1$
Only available for registered users.
Sign up now to view full answer, or log in if you already have an account!
To solve x2+x−4=−2x−1:
- Rearrange the equation to combine like terms:
x2+3x−3=0.
- Identify points of intersection between the graphs of y=x2+x−4 and y=−2x−1.
- From the graph, estimate where they intersect, which provides the approximate solutions for the equation.
- Based on the graph, the intersections can be estimated at points x=−2 and x=1.
Join the GCSE students using SimpleStudy...
97% of StudentsReport Improved Results
98% of StudentsRecommend to friends
100,000+ Students Supported
1 Million+ Questions answered