12 students take two tests - OCR - GCSE Maths - Question 7 - 2019 - Paper 4
Question 7
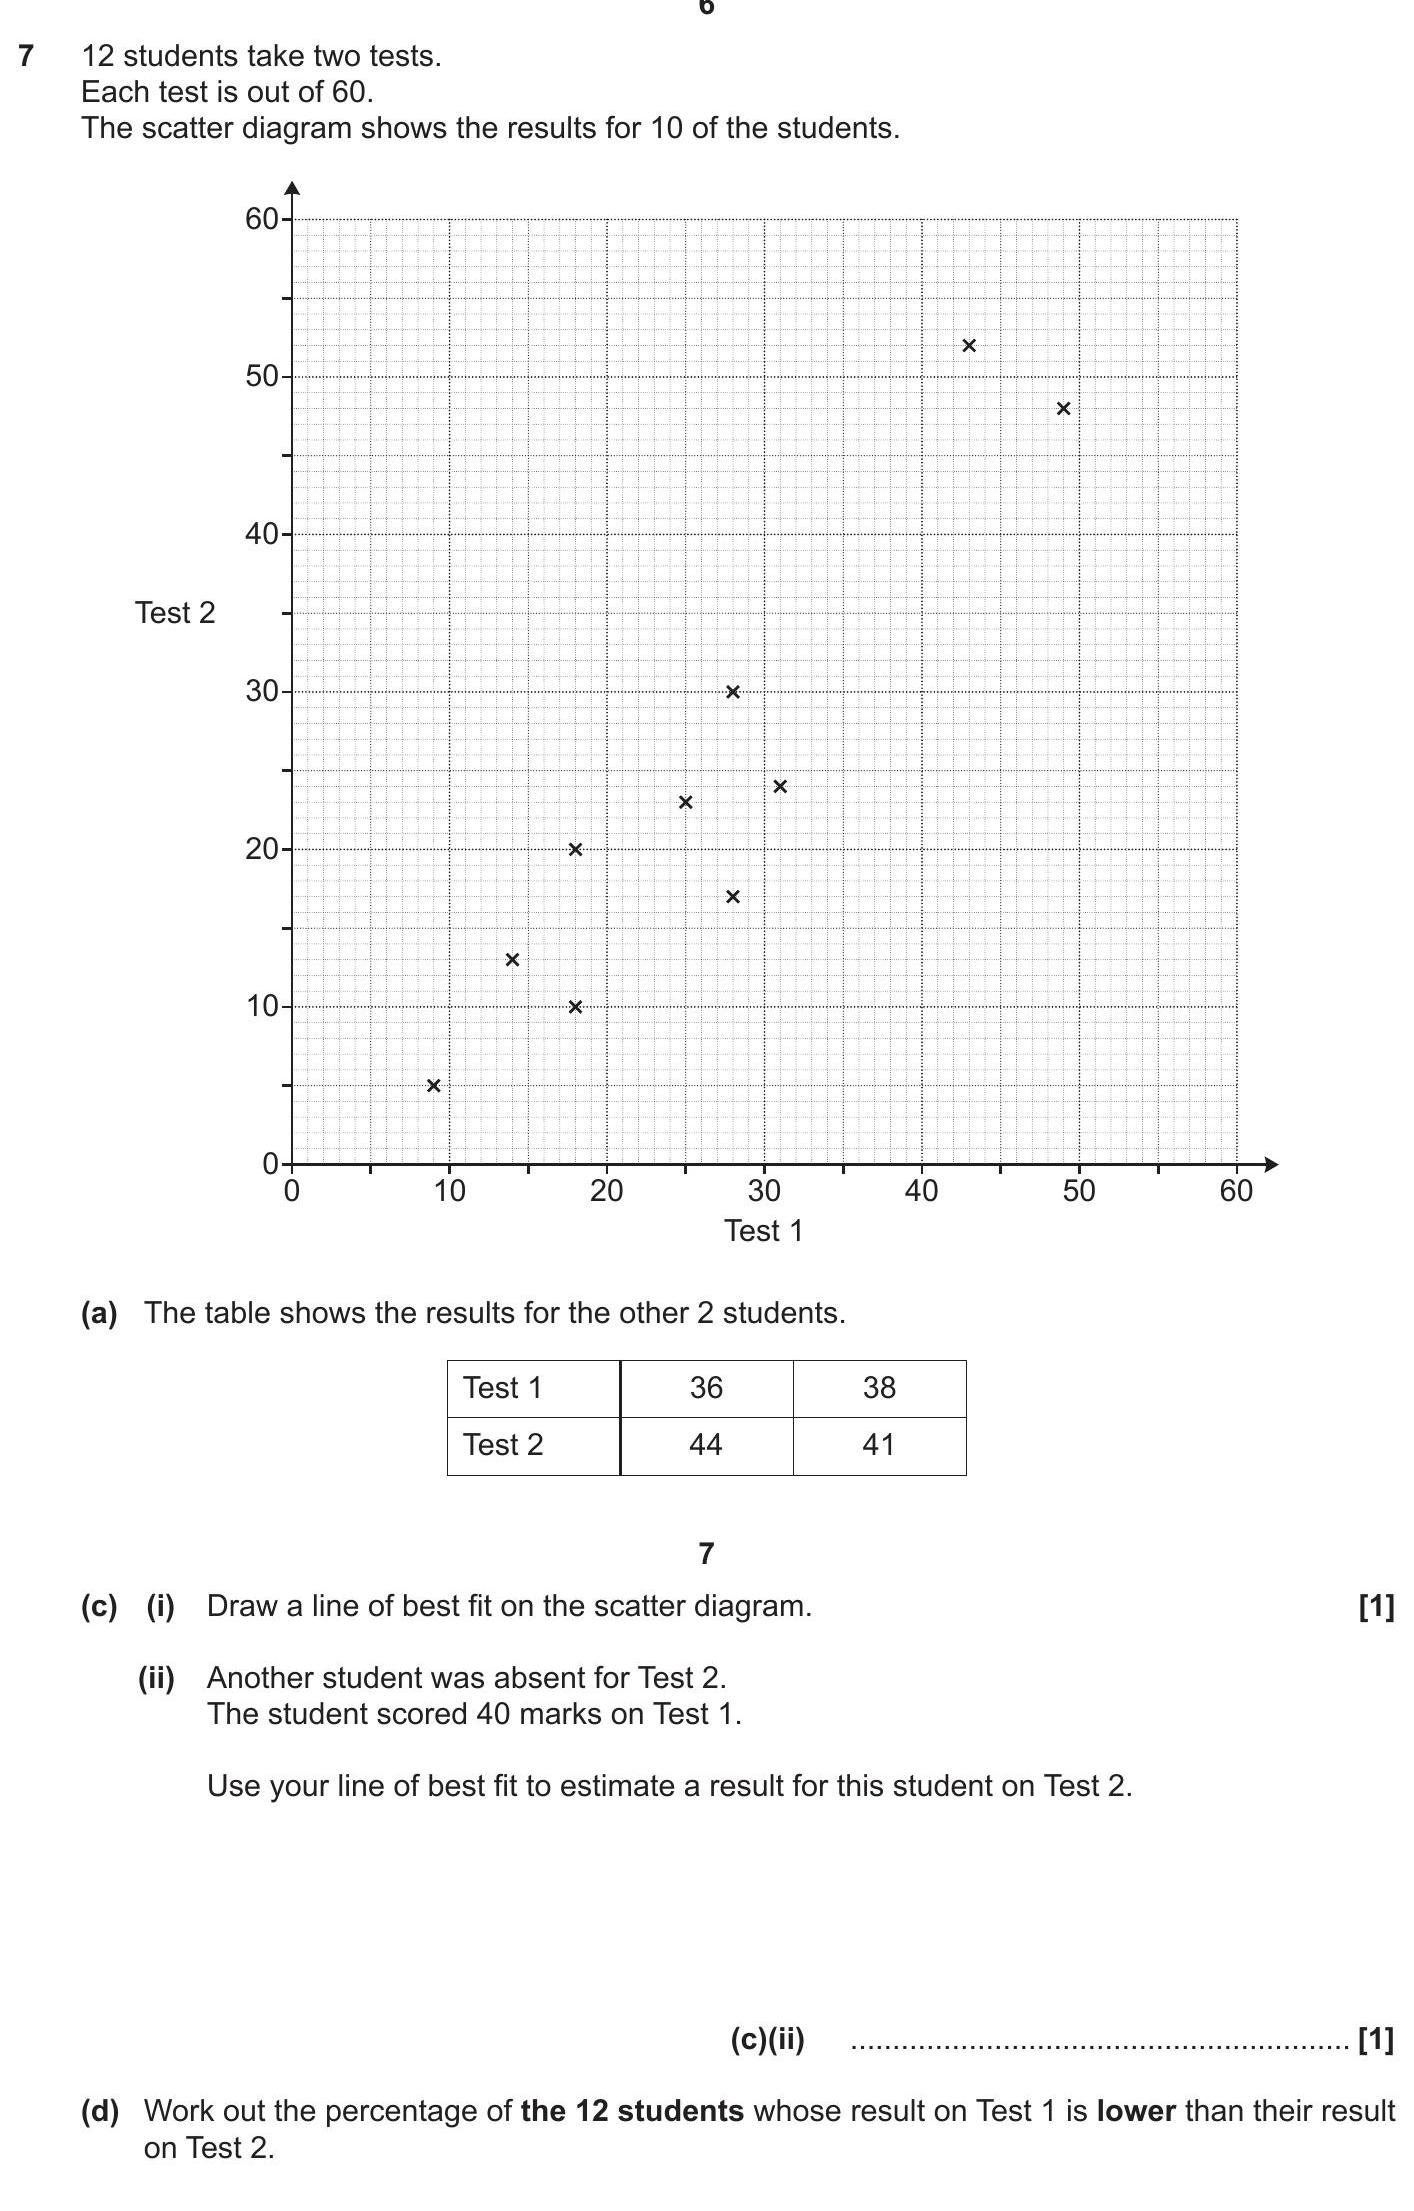
12 students take two tests.
Each test is out of 60.
The scatter diagram shows the results for 10 of the students.
(a) The table shows the results for the other 2 st... show full transcript
Worked Solution & Example Answer:12 students take two tests - OCR - GCSE Maths - Question 7 - 2019 - Paper 4
Step 1
Part (a): Complete the table with results for 2 students
96%
114 rated
Only available for registered users.
Sign up now to view full answer, or log in if you already have an account!
Answer
The table lists results for two students:
Student 1: Test 1 = 36, Test 2 = 44
Student 2: Test 1 = 38, Test 2 = 41
Step 2
Part (c)(i): Draw a line of best fit on the scatter diagram
99%
104 rated
Only available for registered users.
Sign up now to view full answer, or log in if you already have an account!
Answer
To draw a line of best fit on the scatter diagram:
Identify the general trend of the points plotted.
Draw a straight line that best represents all points, ensuring it has approximately equal numbers of points above and below the line.
Step 3
Part (c)(ii): Estimate result for a student who scored 40 on Test 1
96%
101 rated
Only available for registered users.
Sign up now to view full answer, or log in if you already have an account!
Answer
Using the line of best fit, locate where Test 1 score of 40 intersects the line. For this score, you can estimate that the corresponding score on Test 2 is approximately 42 to 44.
Step 4
Part (d): Calculate the percentage of students with lower Test 1 scores
98%
120 rated
Only available for registered users.
Sign up now to view full answer, or log in if you already have an account!
Answer
From the available data:
Count the number of students (from the 12 total) whose Test 1 scores are lower than their Test 2 scores.
Assume 5 out of 12 students fit this criterion. Thus, the percentage is calculated as:
rac{5}{12} imes 100 ext{ to get: } 41.67\%
Therefore, 41.67% of the students had their Test 1 scores lower than their Test 2 scores.