Photo AI
Find the interquartile range - OCR - GCSE Maths - Question 14 - 2019 - Paper 4
Question 14
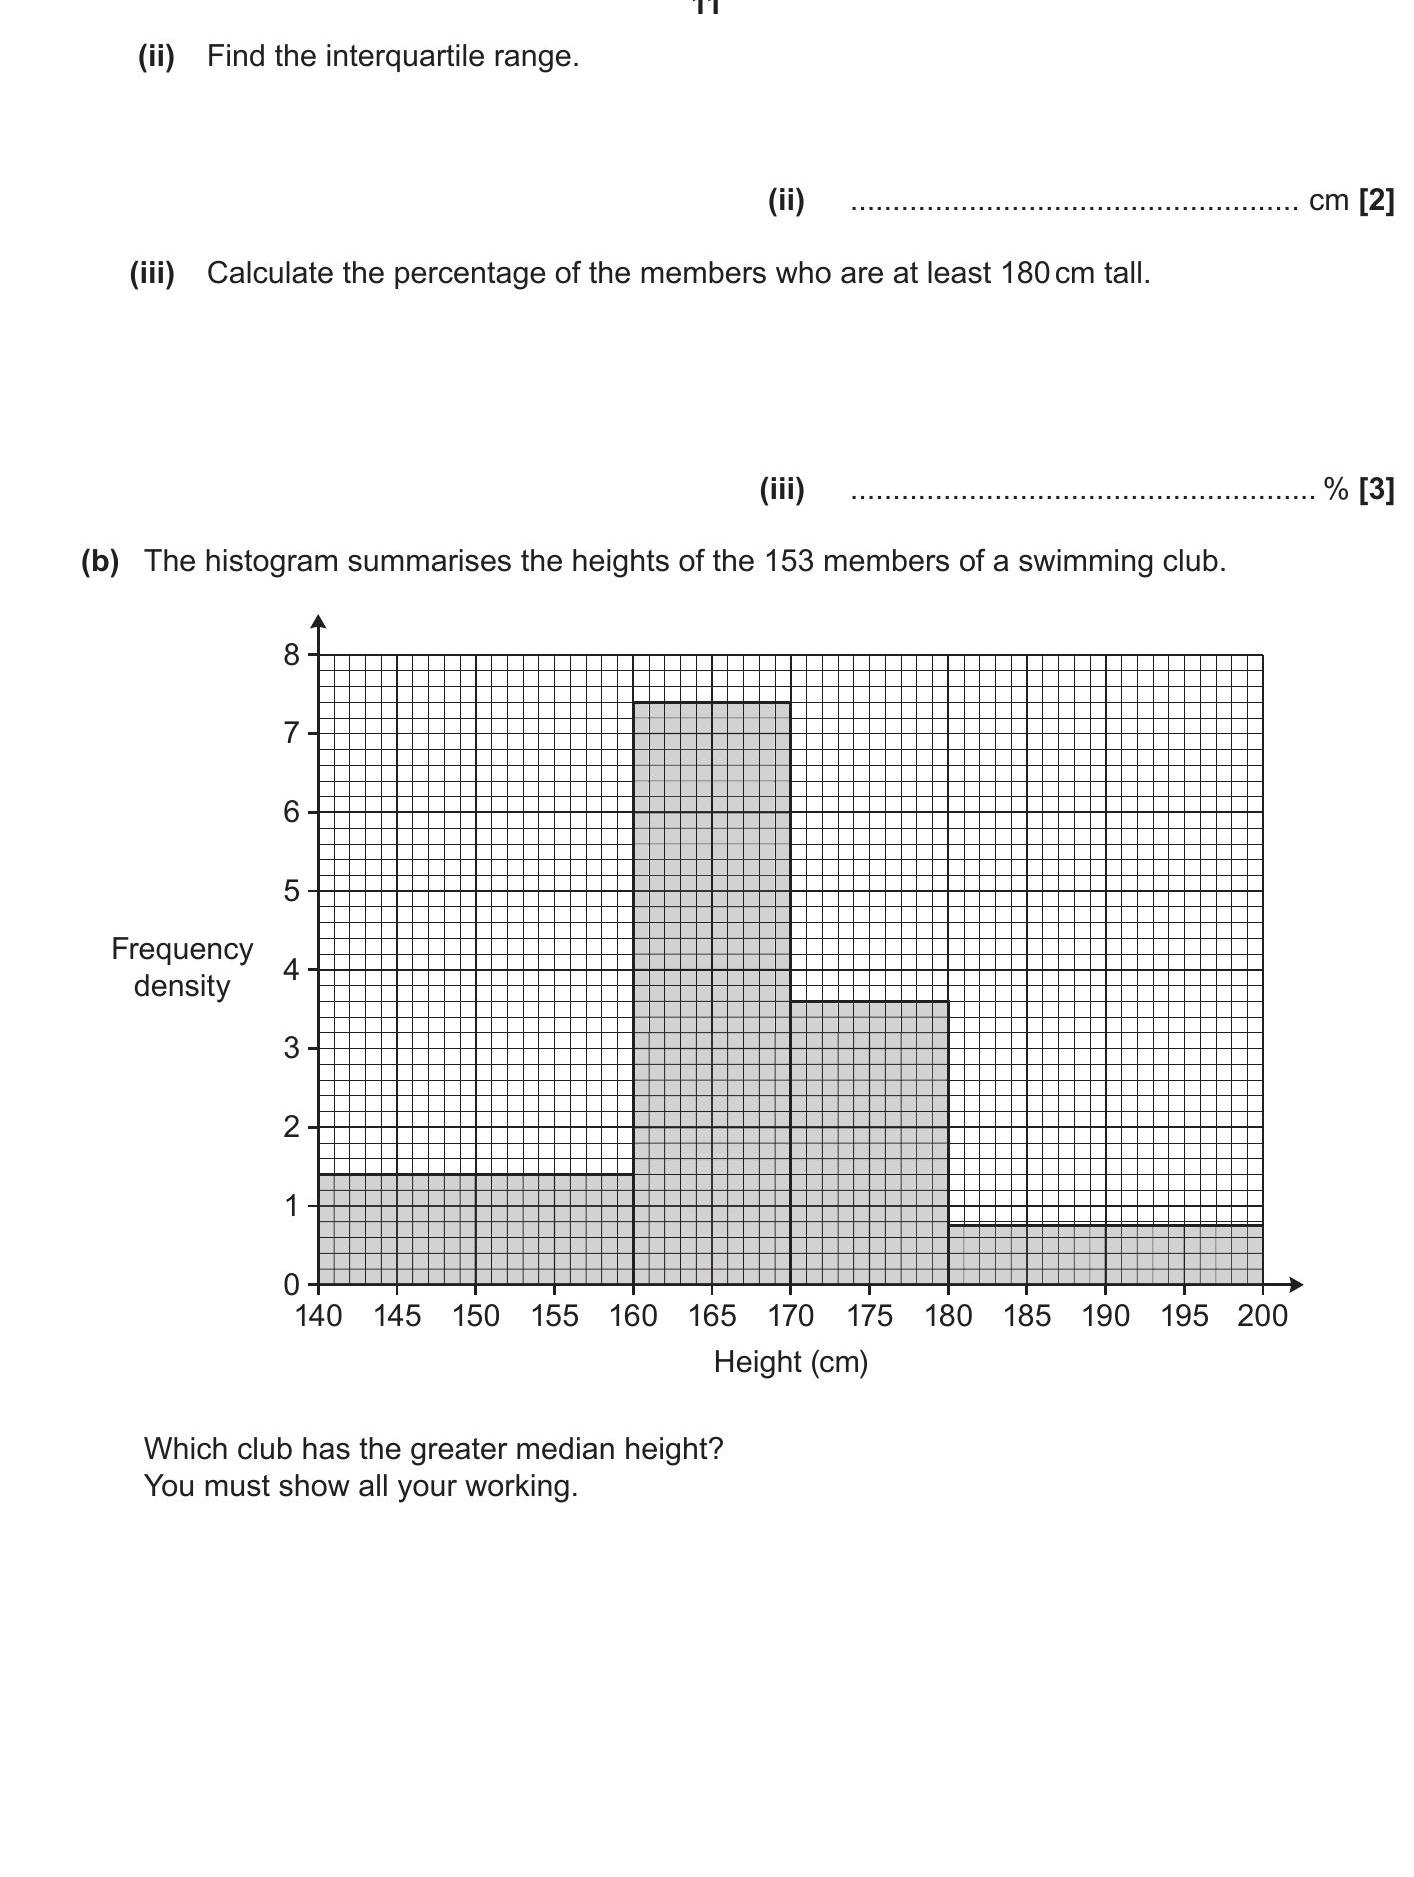
Find the interquartile range. Calculate the percentage of the members who are at least 180 cm tall. The histogram summarises the heights of the 153 members of a sw... show full transcript
Worked Solution & Example Answer:Find the interquartile range - OCR - GCSE Maths - Question 14 - 2019 - Paper 4
Step 1
Find the interquartile range.

Answer
To find the interquartile range (IQR), first identify the first quartile (Q1) and the third quartile (Q3) from the data.
-
Count the total number of members, which is 153.
-
Calculate Q1 and Q3:
- Q1 is the value at the 25th percentile, which is the 39th member in the sorted list.
- Q3 is the value at the 75th percentile, which is the 115th member in the sorted list.
-
Compute the IQR using the formula:
where Q1 and Q3 are the respective heights at those positions.
Step 2
Calculate the percentage of the members who are at least 180 cm tall.
Answer
To find the percentage of members at least 180 cm tall:
-
Count the number of members who are 180 cm tall or taller by examining the histogram.
-
If 'x' is the number of members who are >= 180 cm, the percentage can be calculated using the formula:
-
Substitute 'x' with the count obtained from the histogram for the final calculation.
Step 3
Which club has the greater median height? You must show all your working.
Answer
To determine which club has the greater median height:
-
Calculate the median height from the histogram. The median is the height corresponding to the 76.5th percentile since there are 153 members (use the formula:
where 'n' is the number of members).
-
Find the cumulative frequency in the histogram until reaching the 76.5th percentile and identify the corresponding height.
-
Compare this median height with the other club's height if provided or conclude based on the calculations.