Photo AI
Last Updated Sep 27, 2025
Ionisation Energy: Trends & Evidence Simplified Revision Notes for A-Level AQA Chemistry
Revision notes with simplified explanations to understand Ionisation Energy: Trends & Evidence quickly and effectively.
259+ students studying
1.1.7 Ionisation Energy: Trends & Evidence
Three Main Factors
Ionisation energy trends across periods and down groups provide strong evidence for electron configurations and energy levels in atoms. These patterns are explained using three main factors.
Atomic Radius
- The greater the atomic radius, the further the outer electron is from the nucleus, requiring less energy to ionise.
- Atomic radius decreases across a period and increases down a group.
Nuclear Charge
- The more protons in the nucleus, the stronger the attraction between the nucleus and the outer electron, making it harder to remove an electron.
- This leads to higher ionisation energies as nuclear charge increases across a period.
Shielding Effect
- Inner electrons shield the outer electrons from the full attraction of the nucleus. The more inner electrons, the greater the shielding, reducing the energy required to remove outer electrons.
- Shielding increases down a group, leading to lower ionisation energies.
Trends in Ionisation Energy
1. Decrease Down a Group
As you move down a group, the first ionisation energy decreases. This is because:
- Atomic radius increases, meaning outer electrons are farther from the nucleus.
- Shielding by inner electrons increases, reducing the attraction from the nucleus.
For example, in Group 18 (Noble gases):
Ionisation energy decreases down the group.
2. Increase Across a Period
As you move across a period from left to right, the first ionisation energy increases. This is due to:
- Decreasing atomic radius, with electrons being closer to the nucleus.
- Increasing nuclear charge, which pulls outer electrons closer.
- Shielding remains constant because electrons are added to the same energy level.
For example, in Period 3:
The first ionisation energy increases across the period.
3. Zig-Zag Pattern in Short Periods
Within short periods (e.g., Period 2 and Period 3), a zig-zag pattern can be observed:
- Group 3 elements (e.g., B, Al) show a drop in ionisation energy. This is because the added electron enters a higher-energy sub-shell (p-orbital), which is farther from the nucleus and more shielded.
- Group 6 elements (e.g., O, S) also show a drop due to electron pairing in the p-orbital, which causes repulsion, making it easier to remove the electron.
Evidence for Electron Configuration in Sub-shells and Shells
Period 3 (Na–Ar)
The ionisation energy trend in Period 3 supports the idea of sub-shells:
- Sodium (Na) starts with a low first ionisation energy as it has a single electron in the 3s orbital.
- As you move across the period, ionisation energy gradually increases as more electrons are added to the 3p sub-shell, with increasing nuclear charge.
In Group 3 elements like Aluminium (Al), there is a drop in ionisation energy compared to Magnesium (Mg). This is because:
- The electron being removed is from a 3p orbital (which is farther from the nucleus) rather than a 3s orbital, and thus requires less energy to remove.
In Group 6 elements like Sulfur (S), there is another drop in ionisation energy due to electron pairing in the 3p orbital, which leads to increased repulsion.
Group 2 (Be–Ba)
In Group 2 elements, successive ionisation energies give evidence of electron configurations in different shells:
- For example, in Beryllium (Be), removing the second electron requires significantly more energy than the first because it is being removed from a full 1s shell, closer to the nucleus.
As you move down Group 2, the first ionisation energy decreases due to:
- Increasing atomic radius.
- Greater shielding from inner electrons.
Patterns in Successive Ionisation Energies
Successive ionisation energies provide evidence for the existence of distinct energy levels. For example, in sodium (Na):
- The first electron is removed from the 3s orbital, requiring relatively low energy.
- There is a large increase in ionisation energy for the second electron, which is being removed from the inner 2p orbital, indicating a lower energy level much closer to the nucleus.
These jumps in ionisation energy support the idea of quantised energy levels within atoms.
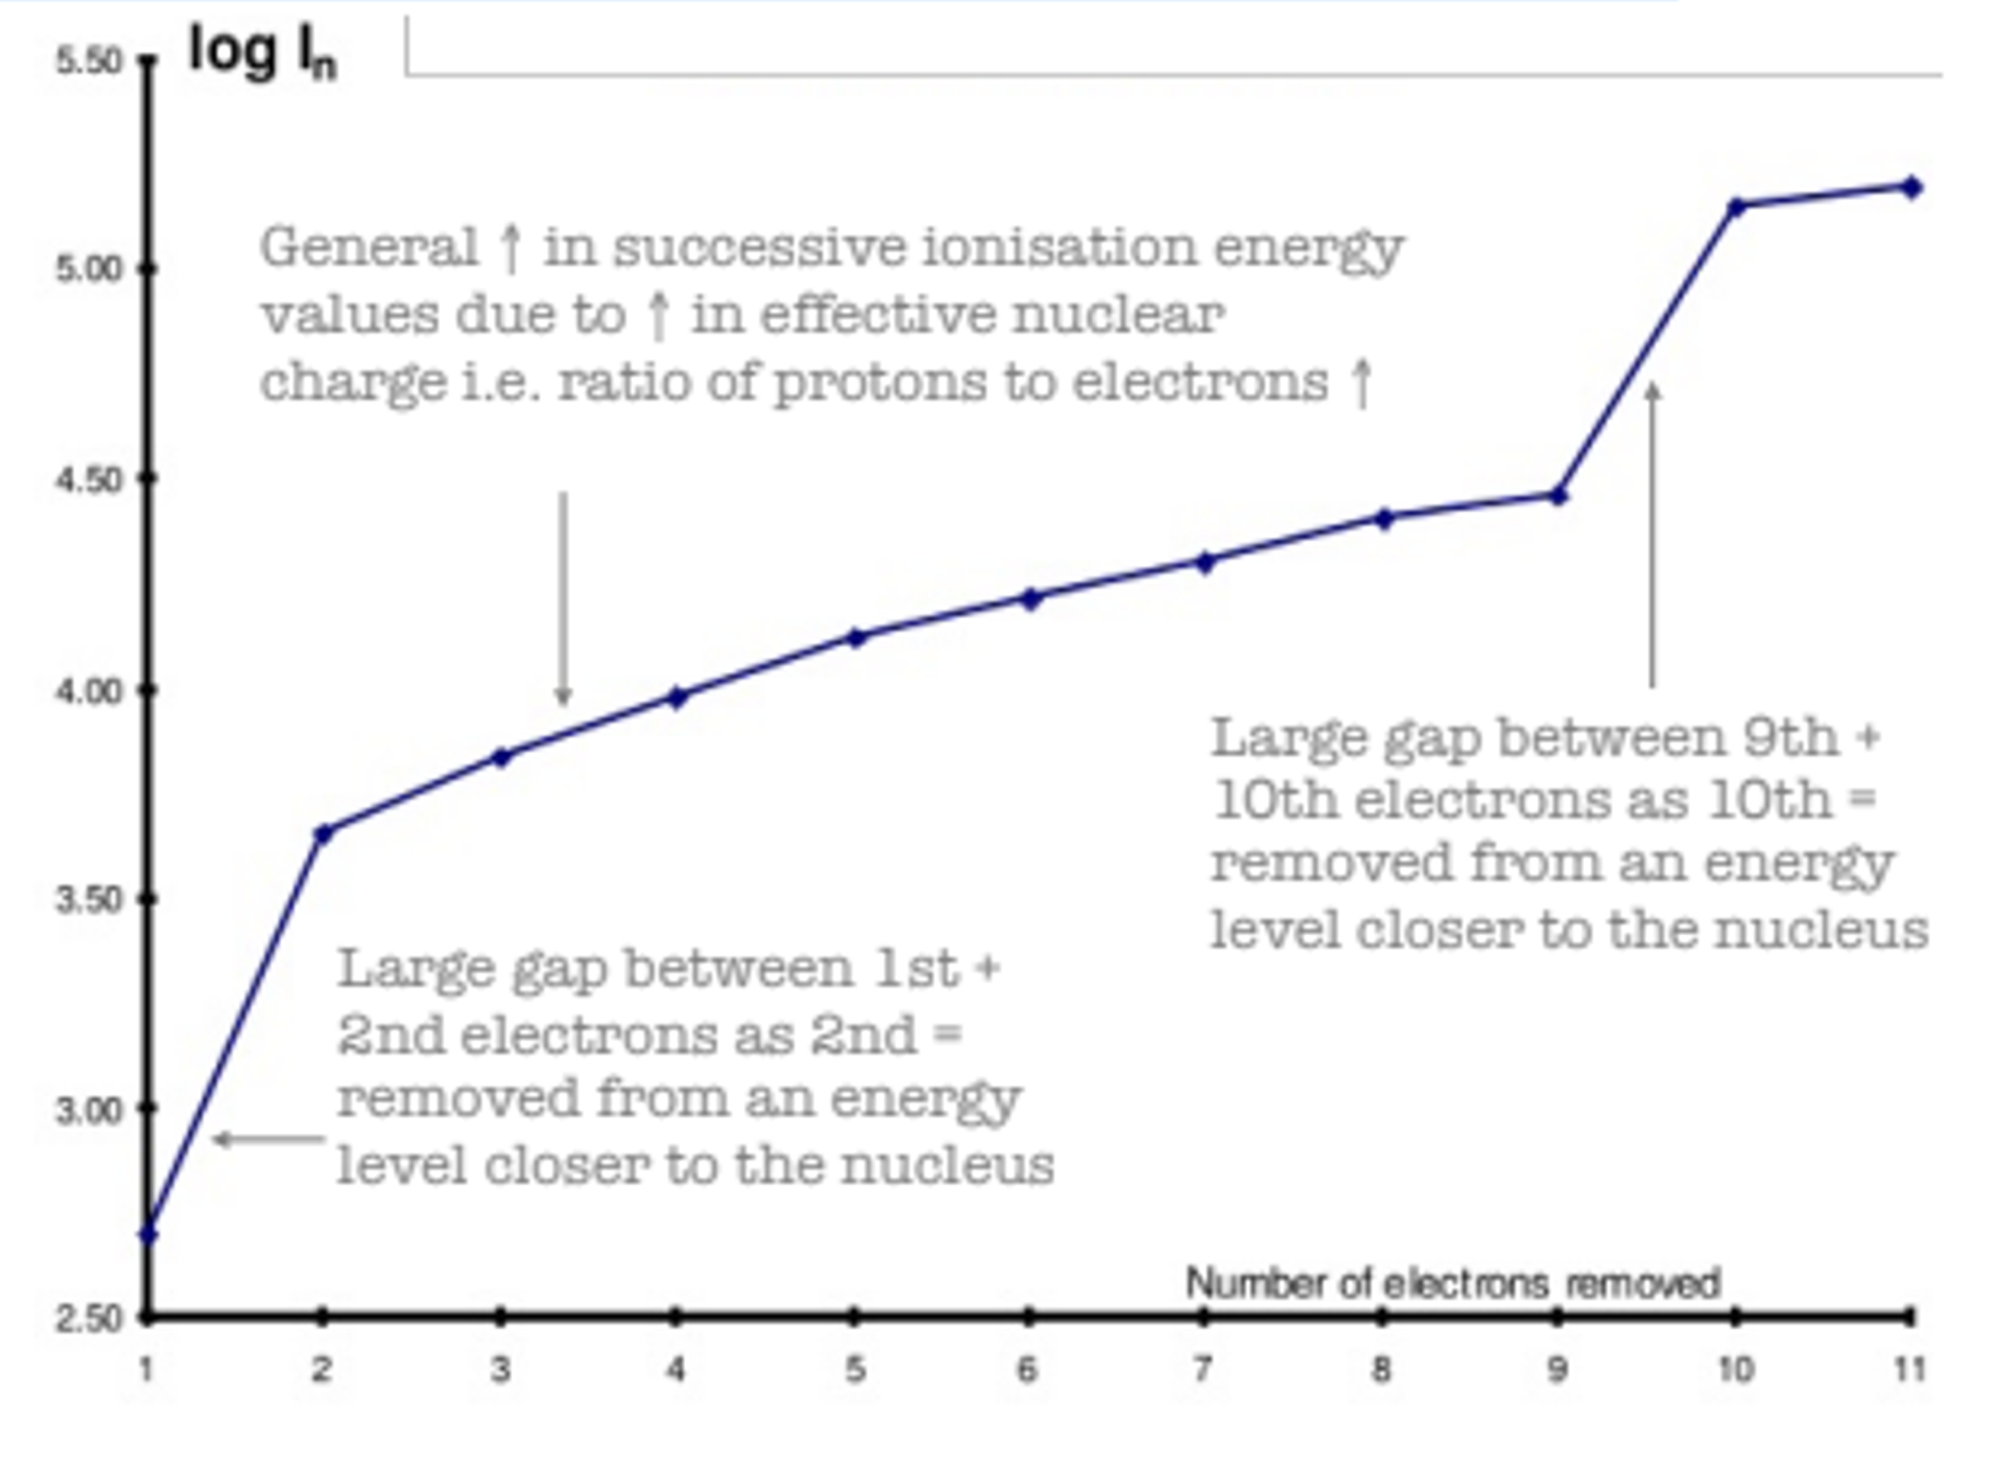
Successive Ionisation Energy Graph
The graph shows how successive ionisation energies increase as more electrons are removed from an atom. As each electron is removed, the attraction between the remaining electrons and the nucleus increases, which raises the amount of energy required to remove the next electron.
Key Points:
- General Increase in Ionisation Energy:
- The general trend shows an increase in ionisation energy as more electrons are removed.
- This is because the effective nuclear charge increases as there are fewer electrons left to shield the nucleus.
- Large Gap Between the 1st and 2nd Electrons:
- A large jump in ionisation energy occurs between the first and second electrons.
- The second electron is being removed from a lower energy level, which is closer to the nucleus and experiences stronger attraction.
- Large Gap Between the 9th and 10th Electrons:
- Another significant increase happens between the removal of the 9th and 10th electrons.
- The 10th electron is removed from an even closer energy level to the nucleus, requiring much more energy due to the higher effective nuclear charge and reduced shielding.

500K+ Students Use These Powerful Tools to Master Ionisation Energy: Trends & Evidence For their A-Level Exams.
Enhance your understanding with flashcards, quizzes, and exams—designed to help you grasp key concepts, reinforce learning, and master any topic with confidence!
70 flashcards
Flashcards on Ionisation Energy: Trends & Evidence
Revise key concepts with interactive flashcards.
Try Chemistry Flashcards7 quizzes
Quizzes on Ionisation Energy: Trends & Evidence
Test your knowledge with fun and engaging quizzes.
Try Chemistry Quizzes29 questions
Exam questions on Ionisation Energy: Trends & Evidence
Boost your confidence with real exam questions.
Try Chemistry Questions27 exams created
Exam Builder on Ionisation Energy: Trends & Evidence
Create custom exams across topics for better practice!
Try Chemistry exam builder21 papers
Past Papers on Ionisation Energy: Trends & Evidence
Practice past papers to reinforce exam experience.
Try Chemistry Past PapersOther Revision Notes related to Ionisation Energy: Trends & Evidence you should explore
Discover More Revision Notes Related to Ionisation Energy: Trends & Evidence to Deepen Your Understanding and Improve Your Mastery