Photo AI
Last Updated Sep 26, 2025
The interaction of markets Simplified Revision Notes for A-Level AQA Economics
Revision notes with simplified explanations to understand The interaction of markets quickly and effectively.
469+ students studying
2.5 The interaction of markets
DEFINITIONS:
- Ceteris Paribus: A Latin phrase meaning "all other things being equal." It is used in economics to isolate the relationship between two variables by assuming that all other influencing factors remain constant.
Explain:
2.5.1 Ceteris paribus
In economics, "economic efficiency" refers to the optimal use of resources to maximize overall welfare or output. It can be achieved when resources are allocated in a way that no one can be made better off without making someone else worse off—this is known as Pareto efficiency.
The term "ceteris paribus" is a Latin phrase meaning "all other things being equal." In the context of economic efficiency, it implies that the analysis of efficiency is conducted while holding other relevant factors constant. This allows economists to isolate the impact of a specific variable or change on economic efficiency without the interference of other changes.
For example, when evaluating the efficiency of a market, ceteris paribus allows us to focus solely on the effects of changes in supply and demand on market equilibrium, assuming no other external factors (like government interventions or changes in consumer preferences) are altering the outcome. This simplifies the analysis and helps in understanding the direct relationship between the variable of interest and economic efficiency.
Explain with Aid of Diagram
2.5.2 The interaction of demand and supply
Explanation of Demand and Supply Interaction
The interaction of demand and supply determines the equilibrium price and quantity in a market. Here's a step-by-step explanation:
- Demand Curve (D): The demand curve shows the relationship between the price of a good and the quantity demanded by consumers. It typically slopes downwards from left to right, indicating that as price decreases, quantity demanded increases.
- Supply Curve (S): The supply curve shows the relationship between the price of a good and the quantity supplied by producers. It typically slopes upwards from left to right, indicating that as price increases, quantity supplied increases.
- Equilibrium: The point where the demand and supply curves intersect is called the market equilibrium. At this point, the quantity demanded by consumers equals the quantity supplied by producers.
- Market Forces: If the market is not at equilibrium, forces will drive it towards equilibrium. For example, if the price is above equilibrium, there will be a surplus (excess supply), causing producers to lower prices. Conversely, if the price is below equilibrium, there will be a shortage (excess demand), causing producers to raise prices.
Diagram:
Below is a simplified diagram illustrating the interaction of demand and supply:
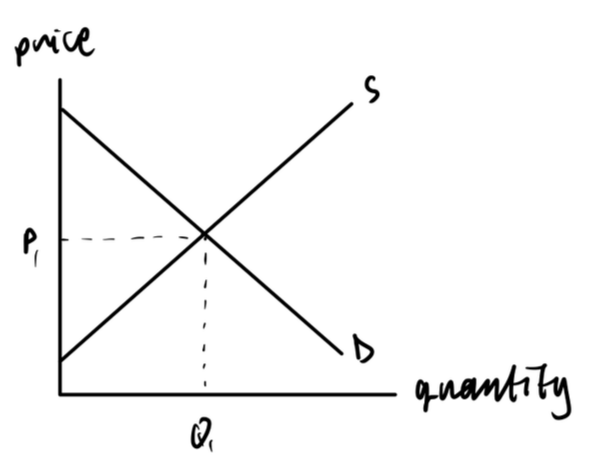
Key Points in the Diagram:
- Demand Curve (D): Downward-sloping, indicating an inverse relationship between price and quantity demanded.
- Supply Curve (S): Upward-sloping, indicating a direct relationship between price and quantity supplied.
- Equilibrium Point (E): The intersection of the demand and supply curves where market equilibrium is established. At this point, the quantity demanded equals the quantity supplied.
- Surplus and Shortage:
- Surplus: If the price is above equilibrium (e.g., ), quantity supplied () exceeds quantity demanded (), creating a surplus.
- Shortage: If the price is below equilibrium (e.g., ), quantity demanded () exceeds quantity supplied (), creating a shortage. In summary, the interaction of demand and supply in a market determines the equilibrium price and quantity. Market forces ensure that any deviations from this equilibrium will self-correct over time, moving towards a balance where the quantity demanded equals the quantity supplied.
2.5.3 Market Equilibrium and Disequilibrium
Explanation:
Market Equilibrium:
-
Definition: Market equilibrium occurs when the quantity demanded () equals the quantity supplied (Qs) at a particular price level. At this point, the market clears, and there is no tendency for the price to change.
-
Equilibrium Price (): The price at which the quantity demanded equals the quantity supplied.
-
Equilibrium Quantity (): The quantity bought and sold at the equilibrium price. Disequilibrium:
-
Definition: Disequilibrium occurs when the market price is not at the equilibrium level, resulting in either excess supply (surplus) or excess demand (shortage).
Diagram:
Below is a simplified diagram illustrating market equilibrium and disequilibrium.
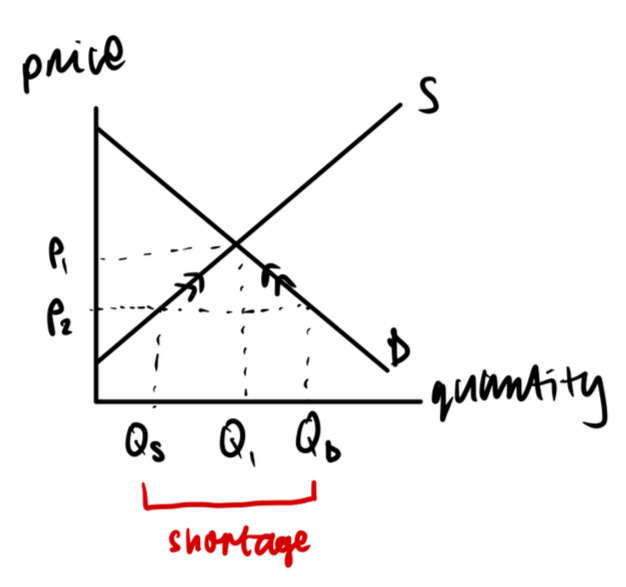
Shortage: Occurs when the price is below the equilibrium price, leading to quantity demanded exceeding quantity supplied.
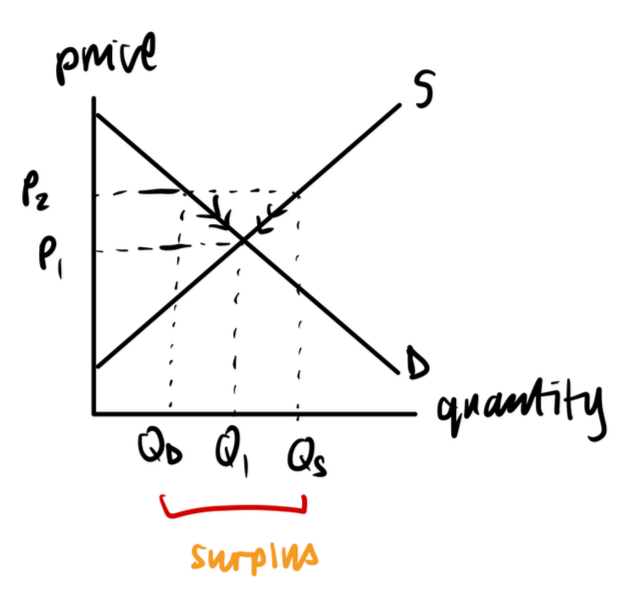
Surplus: Occurs when the price is above the equilibrium price, leading to quantity supplied exceeding quantity demanded.
Key Points in the Diagram:
- Supply Curve (S): Upward-sloping curve representing the relationship between price and quantity supplied.
- Demand Curve (D): Downward-sloping curve representing the relationship between price and quantity demanded.
- Equilibrium (E): The point where the supply and demand curves intersect, indicating the equilibrium price () and equilibrium quantity ().
Disequilibrium Scenarios:
- Surplus (Excess Supply):
- If the price is set above , say at , then > .
- Producers are willing to supply more than consumers are willing to buy, resulting in a surplus.
- This surplus will put downward pressure on the price, moving it back toward .
- Shortage (Excess Demand):
- If the price is set below , say at , then > .
- Consumers want to buy more than producers are willing to supply, resulting in a shortage.
- This shortage will put upward pressure on the price, moving it back toward .
Summary:
- Equilibrium is achieved where at , with no excess supply or demand.
- Disequilibrium results in either a surplus (excess supply) or shortage (excess demand), causing price adjustments toward equilibrium.

500K+ Students Use These Powerful Tools to Master The interaction of markets For their A-Level Exams.
Enhance your understanding with flashcards, quizzes, and exams—designed to help you grasp key concepts, reinforce learning, and master any topic with confidence!
110 flashcards
Flashcards on The interaction of markets
Revise key concepts with interactive flashcards.
Try Economics Flashcards11 quizzes
Quizzes on The interaction of markets
Test your knowledge with fun and engaging quizzes.
Try Economics Quizzes29 questions
Exam questions on The interaction of markets
Boost your confidence with real exam questions.
Try Economics Questions27 exams created
Exam Builder on The interaction of markets
Create custom exams across topics for better practice!
Try Economics exam builder12 papers
Past Papers on The interaction of markets
Practice past papers to reinforce exam experience.
Try Economics Past PapersOther Revision Notes related to The interaction of markets you should explore
Discover More Revision Notes Related to The interaction of markets to Deepen Your Understanding and Improve Your Mastery