Photo AI
Last Updated Sep 26, 2025
Markets Simplified Revision Notes for A-Level OCR Business
Revision notes with simplified explanations to understand Markets quickly and effectively.
207+ students studying
1.2.3 Markets
Equilibrium point
🔗 When the quantity demanded is the same as the quantity supplied.
- There are no surpluses of products (more products than needed] and no shortages of products (not enough products to meet demand).
As demand curves shift, new equilibrium points are created. Businesses try and remain in equilibrium. So, if demand increases, suppliers will increase output to meet demand. Equilibrium price and quantity have risen
Example
- Demand Curve (D): Downward-sloping, showing that as the price decreases, the quantity demanded increases.
- Supply Curve (S): Upward-sloping, showing that as the price increases, the quantity supplied increases.
- Equilibrium Point (E): The point where the supply and demand curves intersect, indicating the equilibrium price and quantity.
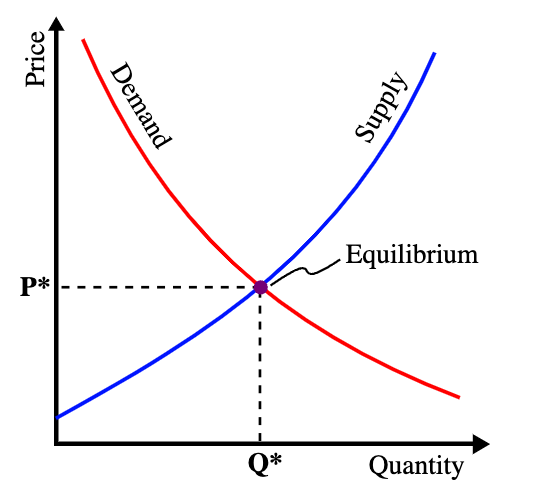
Interpretation of the Supply and Demand Diagram
In the diagram:
- Demand Curve (D):
- The downward-sloping demand curve shows the relationship between price and quantity demanded. As the price decreases from higher levels, the quantity demanded increases. This inverse relationship reflects consumer behaviour: at lower prices, more consumers are willing and able to purchase the product.
- Supply Curve (S):
- The upward-sloping supply curve shows the relationship between price and quantity supplied. As the price increases, producers are willing to supply more of the product because higher prices typically lead to higher potential profits.
- Equilibrium Point (E):
- The point where the supply and demand curves intersect is the equilibrium. At this point, the quantity demanded by consumers equals the quantity supplied by producers.
- *Equilibrium Price (P)**: The price at which the market clears, meaning there is neither excess supply (surplus) nor excess demand (shortage).
- *Equilibrium Quantity (Q)**: The quantity bought and sold at the equilibrium price.
Changes in the supply and demand curves
Interpretation of Diagrams
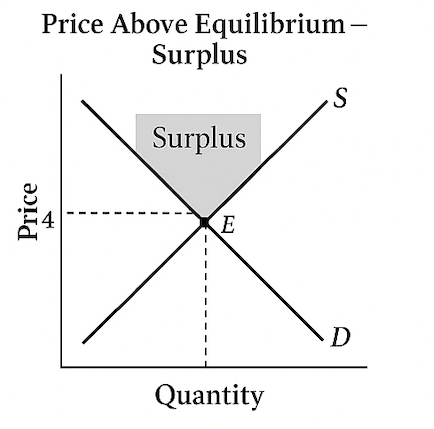
Price Above Equilibrium - Surplus:
- Scenario: The price is set above the equilibrium price.
- Consequence: At this higher price, the quantity supplied exceeds the quantity demanded, resulting in a surplus.
- Market Adjustment: To clear the surplus, producers may lower prices, moving the market back towards the equilibrium point (E).
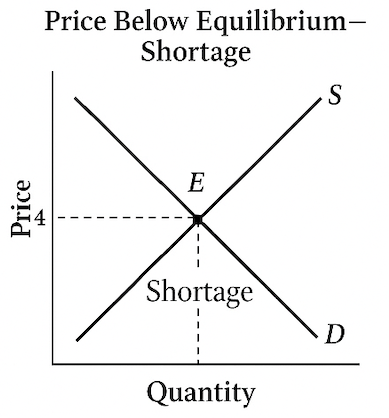
Price Below Equilibrium - Shortage:
- Scenario: The price is set below the equilibrium price.
- Consequence: At this lower price, the quantity demanded exceeds the quantity supplied, leading to a shortage.
- Market Adjustment: To address the shortage, prices are likely to rise, pushing the market back towards equilibrium.
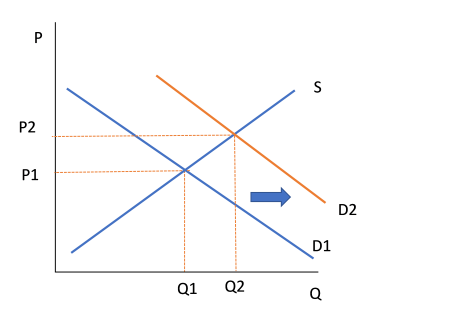
Increase in Demand - New Equilibrium:
- Scenario: The demand curve shifts to the right (from D1 to D2), indicating an increase in demand at every price level.
- Consequence: The new demand curve intersects the supply curve at a higher price and quantity. The new equilibrium price is higher, and the equilibrium quantity is also higher.
- Market Dynamics: This reflects situations where consumer preferences or income increases, leading to higher demand.
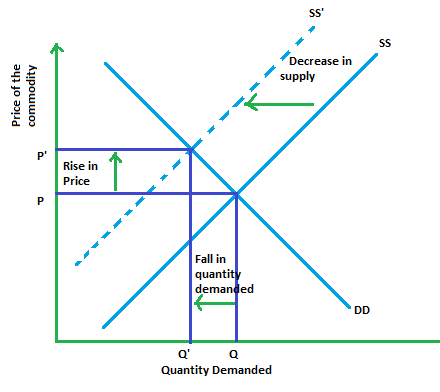
Decrease in Supply - New Equilibrium:
- Scenario: The supply curve shifts to the left (from SS to SS'), indicating a decrease in supply at every price level.
- Consequence: The new supply curve intersects the demand curve at a higher price and lower quantity (E2). The new equilibrium price is higher, and the equilibrium quantity is lower.
- Market Dynamics: This situation could occur due to increased production costs, scarcity of inputs, or other factors that reduce supply.

500K+ Students Use These Powerful Tools to Master Markets For their A-Level Exams.
Enhance your understanding with flashcards, quizzes, and exams—designed to help you grasp key concepts, reinforce learning, and master any topic with confidence!
50 flashcards
Flashcards on Markets
Revise key concepts with interactive flashcards.
Try Business Flashcards29 questions
Exam questions on Markets
Boost your confidence with real exam questions.
Try Business Questions27 exams created
Exam Builder on Markets
Create custom exams across topics for better practice!
Try Business exam builder21 papers
Past Papers on Markets
Practice past papers to reinforce exam experience.
Try Business Past PapersOther Revision Notes related to Markets you should explore
Discover More Revision Notes Related to Markets to Deepen Your Understanding and Improve Your Mastery