Photo AI
Last Updated Sep 26, 2025
Graphs of Potential Difference in the Coil Simplified Revision Notes for GCSE AQA Physics
Revision notes with simplified explanations to understand Graphs of Potential Difference in the Coil quickly and effectively.
236+ students studying
7.3.3 Graphs of Potential Difference in the Coil
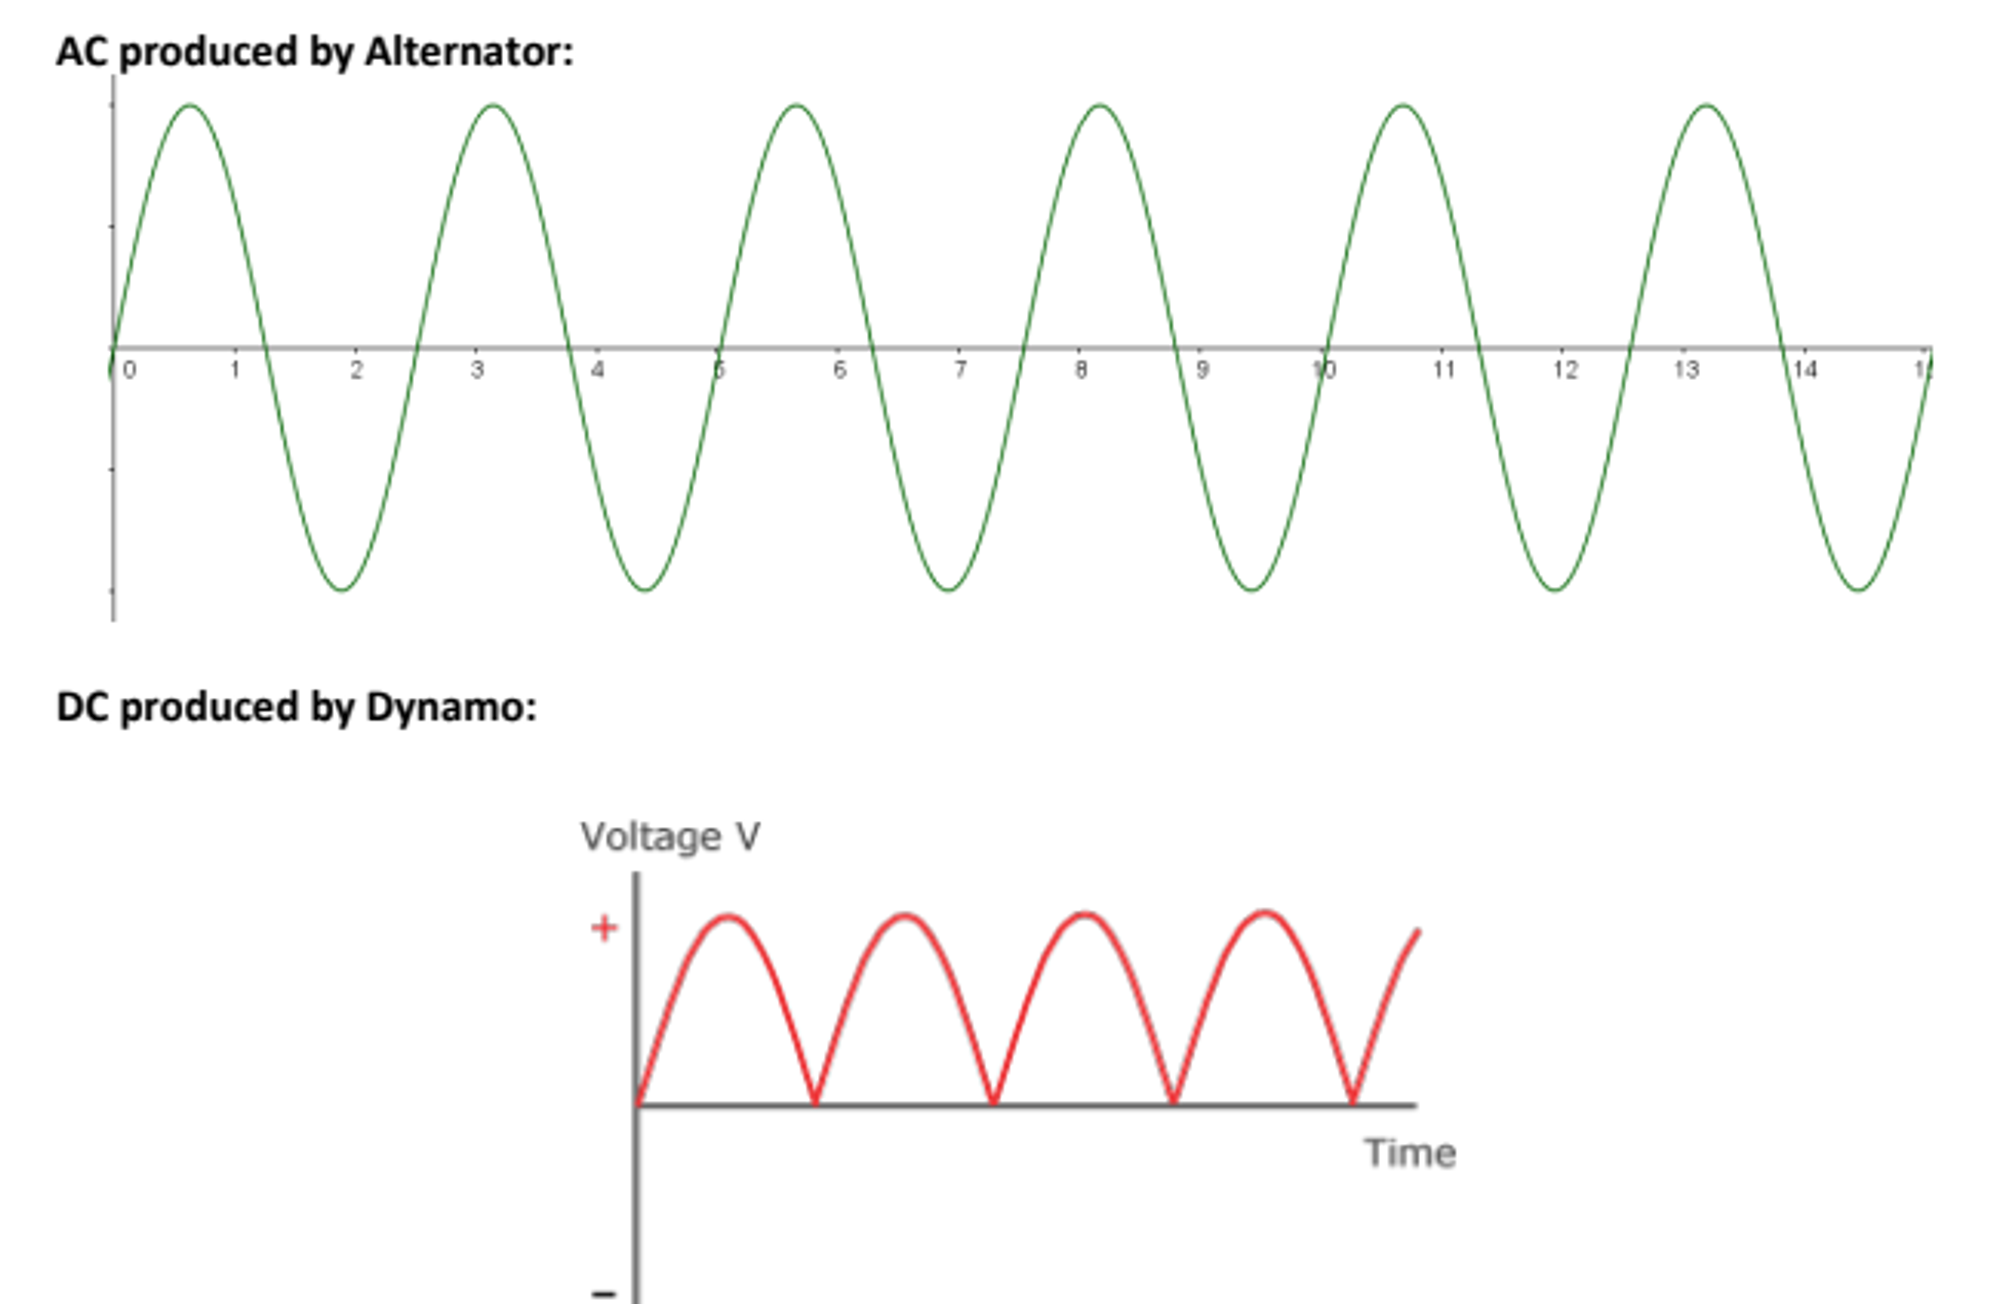
When a coil rotates within a magnetic field, it experiences a changing magnetic flux, which induces a potential difference across its ends.
Here's how to represent this on a graph:
How to Draw the Graph
- Setting Up the Axes:
- On graph paper, label the horizontal axis as "Time (s)" and the vertical axis as "Potential Difference (V)".
- Ensure you choose appropriate scales for both axes to accurately plot the data.
- Collecting Data:
- As the coil rotates, determine the potential difference at various time intervals. This will depend on factors like the speed of rotation, magnetic field strength, and the number of turns in the coil.
- Plotting the Points:
- For each time interval, plot the corresponding potential difference on the graph. Repeat this for multiple intervals to capture the full cycle of rotation.
- Drawing the Curve:
- Connect the plotted points with a smooth curve. This curve shows how the potential difference changes over time as the coil rotates.
Interpreting the Graph Once the graph is drawn, interpreting it gives you insights into the behaviour of the potential difference:
- Starting Point:
- The graph starts at the origin (0 V) because no potential difference is generated when the coil is stationary.
- Shape of the Curve:
- The curve's shape depends on the coil's rotation speed and the magnetic field's strength. Typically, the potential difference increases as the coil rotates, peaks when the coil is perpendicular to the magnetic field lines, and then decreases.
- Periodic Variation:
- If the coil makes multiple rotations, the graph will show a repeating pattern. The potential difference will rise and fall in a cyclical manner, reflecting the continuous rotation of the coil.
- Maximum Potential Difference:
- The highest points on the graph represent the maximum potential difference, which occurs when the coil is aligned perpendicularly to the magnetic field.
- Direction of Potential Difference:
- The potential difference may change direction (sign) depending on the rotation direction of the coil. This is reflected in the graph by the curve crossing the horizontal axis (indicating a switch from positive to negative voltage or vice versa).

500K+ Students Use These Powerful Tools to Master Graphs of Potential Difference in the Coil For their GCSE Exams.
Enhance your understanding with flashcards, quizzes, and exams—designed to help you grasp key concepts, reinforce learning, and master any topic with confidence!
70 flashcards
Flashcards on Graphs of Potential Difference in the Coil
Revise key concepts with interactive flashcards.
Try Physics Flashcards7 quizzes
Quizzes on Graphs of Potential Difference in the Coil
Test your knowledge with fun and engaging quizzes.
Try Physics Quizzes13 questions
Exam questions on Graphs of Potential Difference in the Coil
Boost your confidence with real exam questions.
Try Physics Questions3 exams created
Exam Builder on Graphs of Potential Difference in the Coil
Create custom exams across topics for better practice!
Try Physics exam builder25 papers
Past Papers on Graphs of Potential Difference in the Coil
Practice past papers to reinforce exam experience.
Try Physics Past PapersOther Revision Notes related to Graphs of Potential Difference in the Coil you should explore
Discover More Revision Notes Related to Graphs of Potential Difference in the Coil to Deepen Your Understanding and Improve Your Mastery
96%
114 rated
Induced Potential, Transformers & the National Grid
Electromagnetic (EM) Induction
369+ studying
197KViews96%
114 rated
Induced Potential, Transformers & the National Grid
Applications of the Generator Effect
362+ studying
186KViews96%
114 rated
Induced Potential, Transformers & the National Grid
Microphones
463+ studying
181KViews96%
114 rated
Induced Potential, Transformers & the National Grid
Transformers
413+ studying
180KViews