Photo AI
Last Updated Sep 26, 2025
Investigating ecosystems Simplified Revision Notes for GCSE Edexcel Biology Combined Science
Revision notes with simplified explanations to understand Investigating ecosystems quickly and effectively.
204+ students studying
Investigating ecosystems
Investigating the Relationship Between Organisms and Their Environment Using Quadrats
Aim: The aim of this practical is to investigate the distribution of organisms within an environment and understand how their distribution is affected by abiotic factors. This is done using fieldwork techniques like quadrats and belt transects to study how species are distributed in different areas or along environmental gradients.
Equipment:
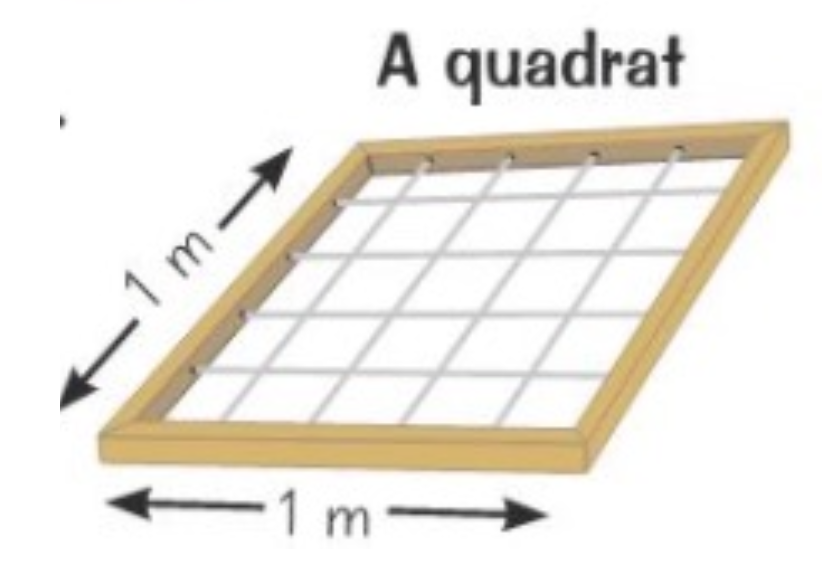
- 1m² quadrat (for measuring distribution)
- Tape measure (for marking out transects)
- Random number generator (to select random coordinates)
- Light meter (to measure light intensity)
- Soil pH meter (to measure soil pH)
- Pen and data sheet (to record results)
What is a quadrat: Square frame enclosing a known area to compare how common an organism is in 2 sample areas
Method
- Place a 1m² quadrat on the ground at a random point within first sample area (can do this by dividing area in a grid & use number generator to pick cords )- this ensures results are representative of the whole sample area
- Count all organisms within quadrat
- Repeat steps 1 & 2
- Work out mean number of organisms per quadrat within 1st sample area
- Repeat steps 1-4 in second sample area
- Compare two means
Example Question:
Students used 0.5 m² quadrats to randomly sample daisies in a field. They found a mean of 10 daisies per quadrat. The field's area was 800 m². Estimate the population of daisies in the field.
- Work out the mean number of organisms per m².
- Multiply the mean per m² by the total area (in m²) of the habitat.
Sometimes abiotic factors will change across a habitat (change is known as gradient), using quadrats will help find out how organisms are distributed along gradient
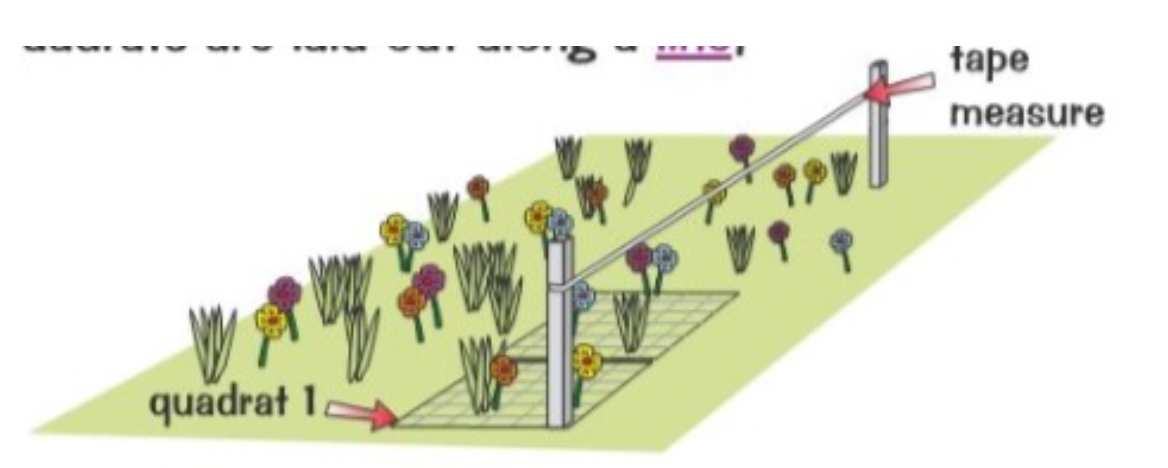
Using a Belt Transect
Belt transect - Quadrats are laid along a line forming a belt transect
Use a belt transect to study distribution along a gradient 9. Mark out a line in the area you want to study 10. Collect data along the line using quadrats placed next to each other (if the transect is long, you can place quadrats at regular intervals) 11. Collect data by counting all organisms of the species you are interested in/ estimate percentage cover 12. Repeat the steps to find the mean number/ percentage covered for each quadrat 13. Plot graphs to see if the factors are correlated with a change of distribution You can also record other data (mean height of palms) and your counting/ the abiotic factors in each quadrat (light meter to measure light intensity) You can also record other data (mean height of palms) your counting/ the abiotic factors in each quadrat (light meter to measure light intensity)
Data Collection:
For both the quadrat and belt transect methods, you'll collect the following data:
- Number of organisms or percentage covered within each quadrat.
- Abiotic data, such as light intensity, soil moisture, or soil pH, depending on the focus of your investigation. Example data table for quadrat sampling:
| Quadrat Number | Number of Organisms | Percentage Cover (%) | Light Intensity (lux) |
|---|---|---|---|
| 1 | 5 | 50 | 200 |
| 2 | 7 | 60 | 250 |
| 3 | 6 | 55 | 180 |
| ... | ... | ... | ... |
Example data table for belt transect sampling:
| Distance along Transect (m) | Number of Organisms | Percentage Cover (%) | Soil pH | Light Intensity (lux) |
|---|---|---|---|---|
| 0 | 4 | 45 | 6.5 | 150 |
| 5 | 6 | 55 | 6.8 | 160 |
| 10 | 8 | 60 | 7.0 | 180 |
| ... | ... | ... | ... | ... |
Conclusion:
The quadrat and belt transect techniques allow for a detailed analysis of how organisms are distributed across different areas of a habitat or along environmental gradients. By comparing two areas or by examining how organisms change along a transect, you can infer the impact of abiotic factors like light, temperature, or soil pH on the distribution of species in an ecosystem.

500K+ Students Use These Powerful Tools to Master Investigating ecosystems For their GCSE Exams.
Enhance your understanding with flashcards, quizzes, and exams—designed to help you grasp key concepts, reinforce learning, and master any topic with confidence!
10 flashcards
Flashcards on Investigating ecosystems
Revise key concepts with interactive flashcards.
Try Biology Combined Science Flashcards1 quizzes
Quizzes on Investigating ecosystems
Test your knowledge with fun and engaging quizzes.
Try Biology Combined Science Quizzes1 questions
Exam questions on Investigating ecosystems
Boost your confidence with real exam questions.
Try Biology Combined Science Questions27 exams created
Exam Builder on Investigating ecosystems
Create custom exams across topics for better practice!
Try Biology Combined Science exam builder24 papers
Past Papers on Investigating ecosystems
Practice past papers to reinforce exam experience.
Try Biology Combined Science Past PapersOther Revision Notes related to Investigating ecosystems you should explore
Discover More Revision Notes Related to Investigating ecosystems to Deepen Your Understanding and Improve Your Mastery
Load more notes