Photo AI
5.1 FIGURE 5.1 on ANSWER SHEET B shows the space diagram of a lean-to roof - NSC Civil Technology Woodworking - Question 5 - 2017 - Paper 1
Question 5
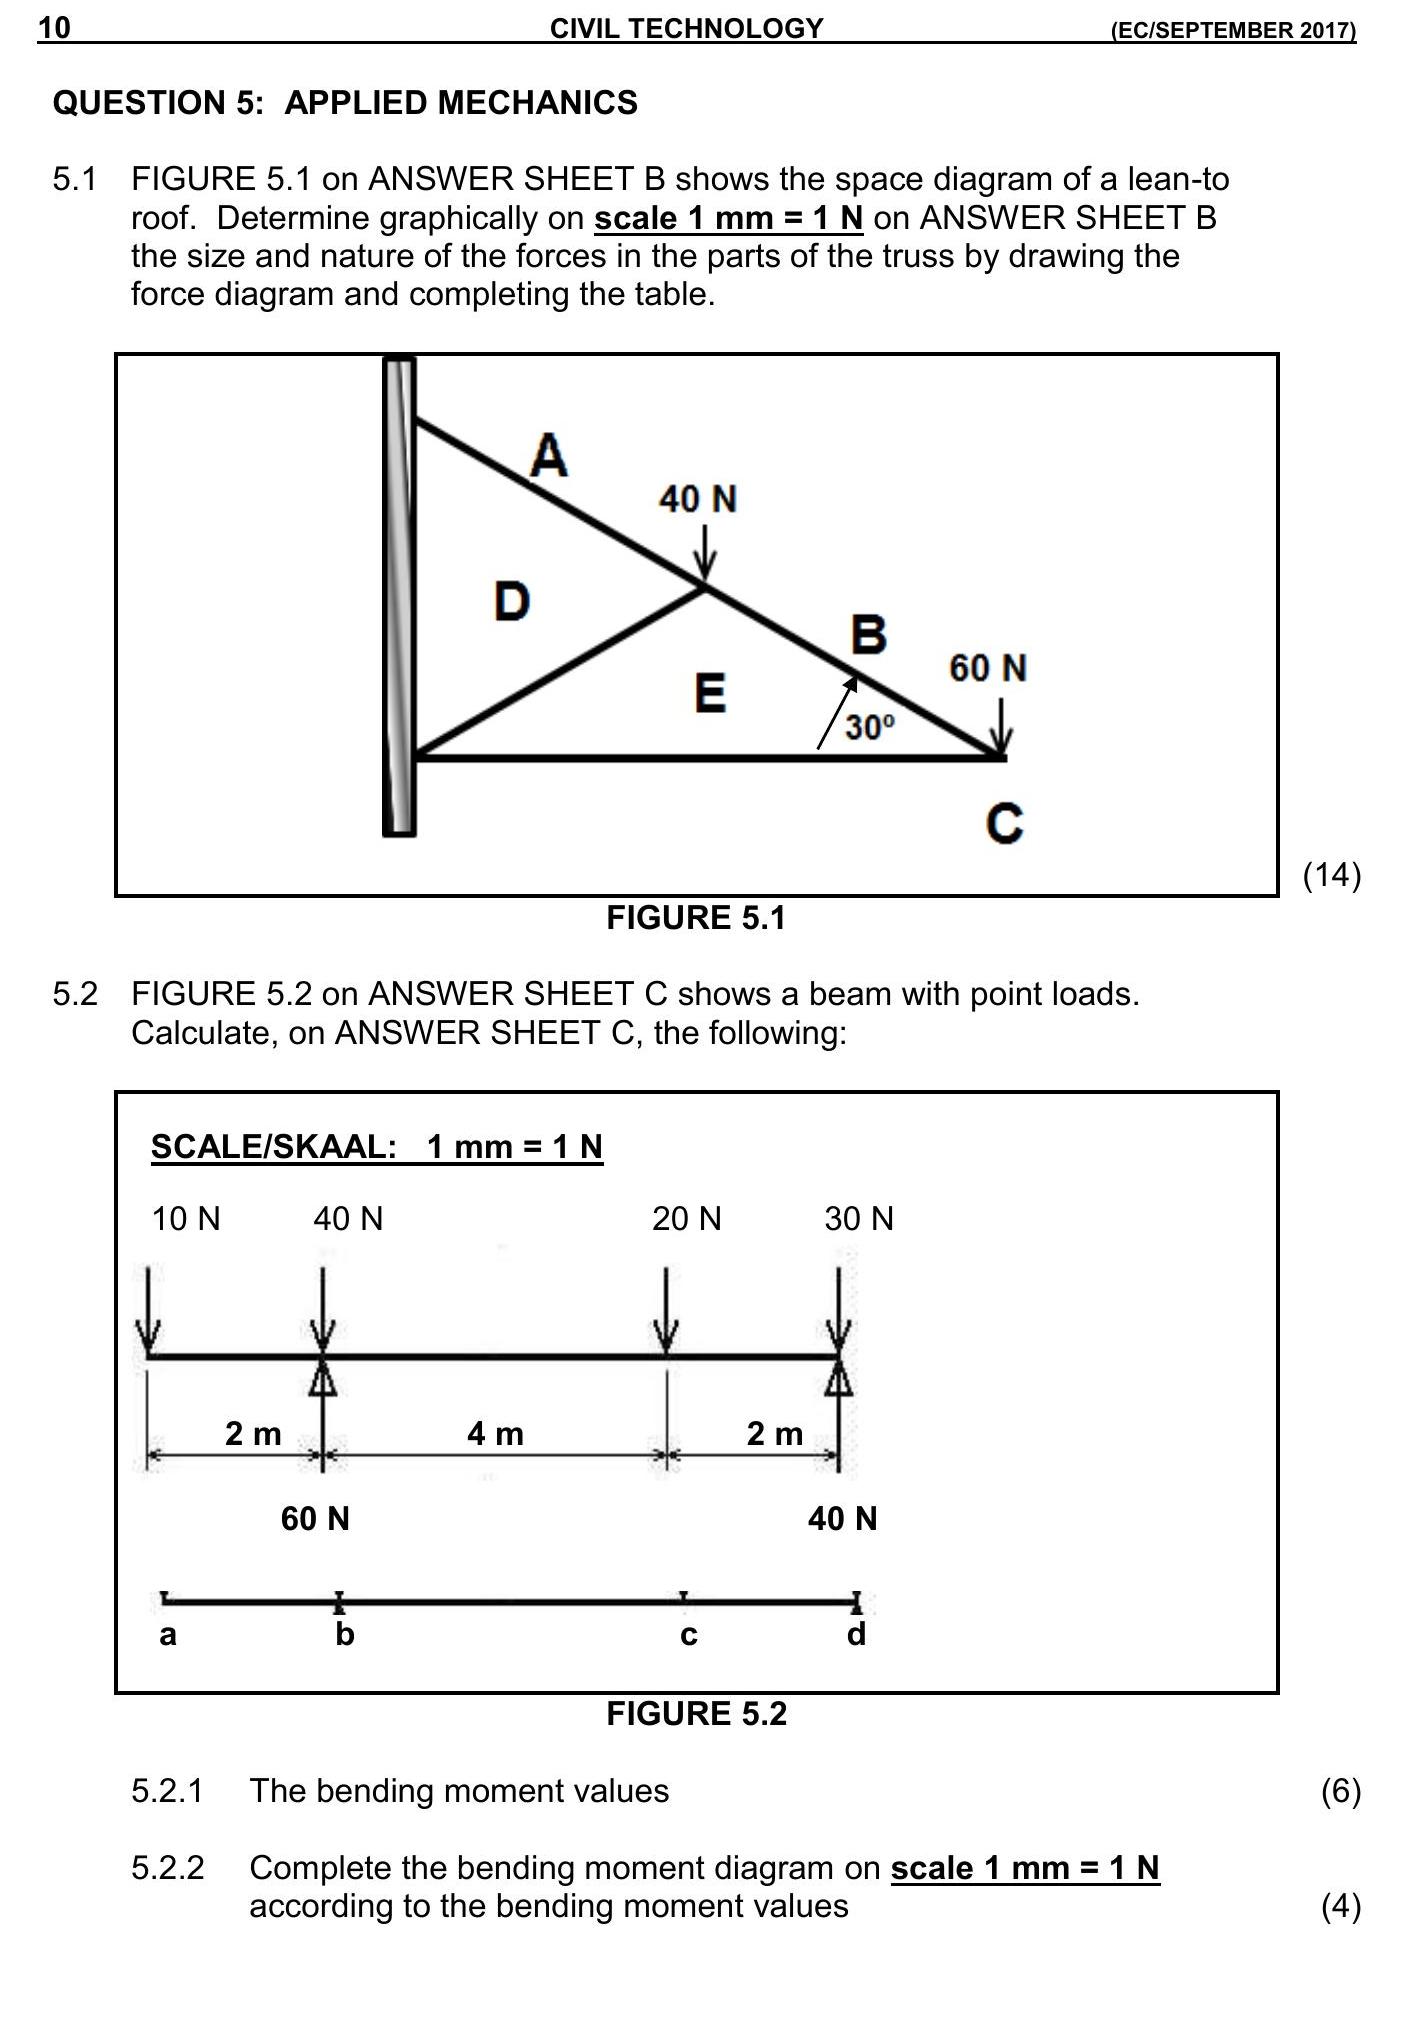
5.1 FIGURE 5.1 on ANSWER SHEET B shows the space diagram of a lean-to roof. Determine graphically on scale 1 mm = 1 N on ANSWER SHEET B the size and nature of the fo... show full transcript
Worked Solution & Example Answer:5.1 FIGURE 5.1 on ANSWER SHEET B shows the space diagram of a lean-to roof - NSC Civil Technology Woodworking - Question 5 - 2017 - Paper 1
Step 1
5.1 Determine graphically on scale 1 mm = 1 N on ANSWER SHEET B the size and nature of the forces in the parts of the truss by drawing the force diagram and completing the table

Answer
To determine the forces in the truss graphically, follow these steps:
- Draw the Force Diagram:
- Represent the given loads: 40 N and 60 N at points A, B, and C as shown in the space diagram.
- Use the scale of 1 mm = 1 N to ensure accurate representations.
- Calculate Angles:
- The angle of inclination at point C is 30 degrees. Ensure to measure accurately while drawing.
- Resolve Forces:
- Resolve the forces at point B into horizontal and vertical components. Use trigonometric functions:
- and
- .
- Resolve the forces at point B into horizontal and vertical components. Use trigonometric functions:
- Draw the Resultant:
- Use the head-to-tail method to draw the resultant force from the components calculated. This gives the size and direction of the internal forces in the truss.
- Complete the Table:
- Fill in the sizes and directions of the determined forces in the required table.
Step 2
5.2.1 The bending moment values
Answer
To calculate the bending moments:
- Identify Points on the Beam:
- Label points as 'a', 'b', 'c', and 'd' as per the given diagram in FIGURE 5.2.
- Apply the Formula for Bending Moments:
- For point loads, use the formula for bending moment: where is the force and is the distance from the point of interest.
- Calculate Individual Moments:
- Calculate moments at various points, accounting for the distribution of forces.
- For example, the moment at point 'a' due to the 40 N load at 'c' will be:
- Tabulate Your Results:
- Prepare a table with labeled points and their respective bending moments.
Step 3
5.2.2 Complete the bending moment diagram on scale 1 mm = 1 N according to the bending moment values
Answer
To complete the bending moment diagram:
-
Mark Bending Moment Values:
- On the horizontal axis represent the lengths of the beam and on the vertical axis the bending moment values.
-
Plot Points:
- Using the bending moment values obtained, plot points on the graph for moments at each critical section of the beam.
-
Draw the Bending Moment Curve:
- Connect the points with a smooth curve to visualize the bending moments along the beam. Ensure proper labeling of maximum positive and negative moments.
-
Scale Appropriately:
- Ensure the scale is maintained as 1 mm = 1 N while plotting the diagram accurately.