The diagram below represents a part of a human ear - NSC Life Sciences - Question 2 - 2016 - Paper 1
Question 2
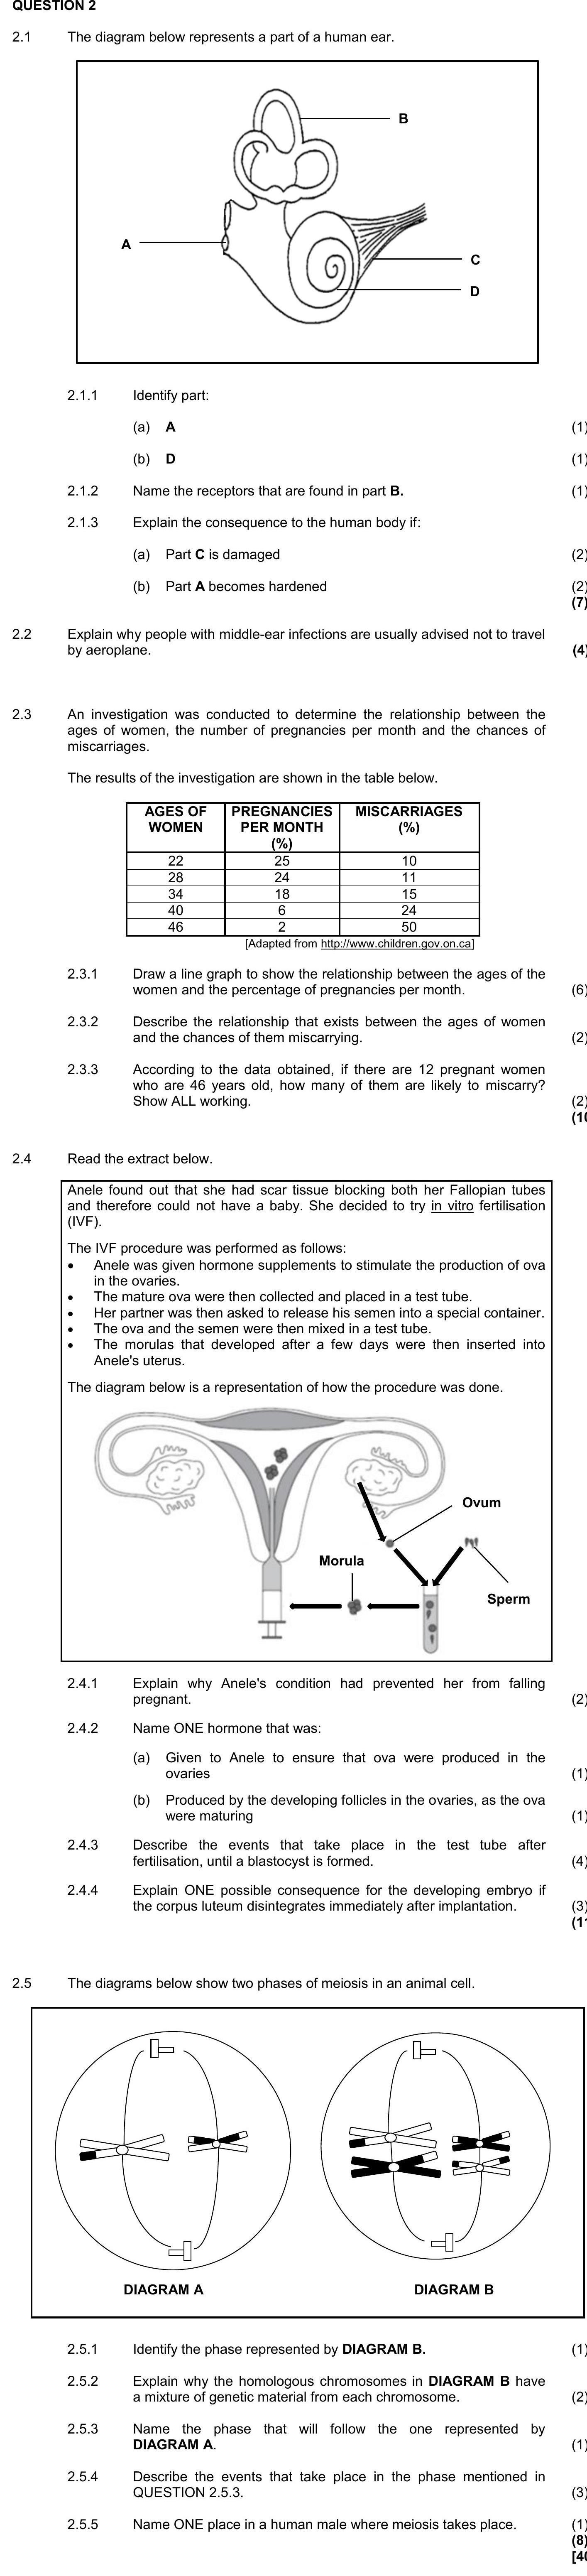
The diagram below represents a part of a human ear.
2.1.1 Identify part:
(a) A
(b) D
2.1.2 Name the receptors that are found in part B.
2.1.3 Explain the conseque... show full transcript
Worked Solution & Example Answer:The diagram below represents a part of a human ear - NSC Life Sciences - Question 2 - 2016 - Paper 1
Step 1
Identify part:
(a) A
96%
114 rated
Only available for registered users.
Sign up now to view full answer, or log in if you already have an account!
Answer
Part A is identified as the cochlea.
Step 2
Identify part:
(b) D
99%
104 rated
Only available for registered users.
Sign up now to view full answer, or log in if you already have an account!
Answer
Part D is identified as the round window.
Step 3
Name the receptors that are found in part B.
96%
101 rated
Only available for registered users.
Sign up now to view full answer, or log in if you already have an account!
Answer
The receptors found in part B are the cristae.
Step 4
Explain the consequence to the human body if:
(a) Part C is damaged
98%
120 rated
Only available for registered users.
Sign up now to view full answer, or log in if you already have an account!
Answer
If Part C is damaged, the impulses from the cochlea cannot be transmitted to the brain, and therefore hearing will not occur.
Step 5
Explain the consequence to the human body if:
(b) Part A becomes hardened
97%
117 rated
Only available for registered users.
Sign up now to view full answer, or log in if you already have an account!
Answer
If Part A becomes hardened, it will not be able to vibrate. Additionally, the round window will not absorb the sound waves from the cochlea, leading to impaired hearing.
Step 6
Explain why people with middle-ear infections are usually advised not to travel by aeroplane.
97%
121 rated
Only available for registered users.
Sign up now to view full answer, or log in if you already have an account!
Answer
People with middle-ear infections may have mucus in the middle ear, which can block the Eustachian tube. This may prevent equalization of pressure in the middle ear, causing pain and potentially leading to a burst tympanic membrane, resulting in hearing loss.
Step 7
Draw a line graph to show the relationship between the ages of women and the percentage of pregnancies per month.
96%
114 rated
Only available for registered users.
Sign up now to view full answer, or log in if you already have an account!
Answer
To draw the line graph, plot the ages of women on the x-axis and the percentage of pregnancies per month on the y-axis. Ensure to label both axes and provide a title that reflects the data shown.
Step 8
Describe the relationship that exists between the ages of women and the chances of them miscarrying.
99%
104 rated
Only available for registered users.
Sign up now to view full answer, or log in if you already have an account!
Answer
The data indicates that as the age of women increases, the percentage of miscarriages also increases. Older women have a higher chance of miscarrying.
Step 9
According to the data obtained, if there are 12 pregnant women who are 46 years old, how many of them are likely to miscarry? Show ALL working.
96%
101 rated
Only available for registered users.
Sign up now to view full answer, or log in if you already have an account!
Answer
According to the data, 100% of women aged 46 are likely to miscarry. Therefore, if there are 12 pregnant women who are 46 years old, all 12 of them are likely to miscarry. Calculation:
12imes100/100=12.
Step 10
Explain why Anele's condition had prevented her from falling pregnant.
98%
120 rated
Only available for registered users.
Sign up now to view full answer, or log in if you already have an account!
Answer
Anele's condition, involving scar tissue blocking her Fallopian tubes, prevents sperm from reaching the ovum. Consequently, fertilisation cannot take place.
Step 11
Name ONE hormone that was:
(a) Given to Anele to ensure that ova were produced in the ovaries
97%
117 rated
Only available for registered users.
Sign up now to view full answer, or log in if you already have an account!
Answer
The hormone given to Anele to ensure that ova were produced is FSH (follicle-stimulating hormone).
Step 12
Name ONE hormone that was:
(b) Produced by the developing follicles in the ovaries, as the ova were maturing.
97%
121 rated
Only available for registered users.
Sign up now to view full answer, or log in if you already have an account!
Answer
The hormone produced by the developing follicles is oestrogen.
Step 13
Describe the events that take place in the test tube after fertilisation, until a blastocyst is formed.
96%
114 rated
Only available for registered users.
Sign up now to view full answer, or log in if you already have an account!
Answer
After fertilisation, a zygote is formed which divides by mitosis, creating a cluster of cells called the morula. The morula further divides to form a hollow ball of cells known as the blastocyst.
Step 14
Explain ONE possible consequence for the developing embryo if the corpus luteum disintegrates immediately after implantation.
99%
104 rated
Only available for registered users.
Sign up now to view full answer, or log in if you already have an account!
Answer
If the corpus luteum disintegrates immediately after implantation, the progesterone levels would drop. Consequently, the endometrium would no longer be maintained and a miscarriage could occur.
Step 15
Identify the phase represented by DIAGRAM B.
96%
101 rated
Only available for registered users.
Sign up now to view full answer, or log in if you already have an account!
Answer
DIAGRAM B represents the metaphase of meiosis.
Step 16
Explain why the homologous chromosomes in DIAGRAM B have a mixture of genetic material from each chromosome.
98%
120 rated
Only available for registered users.
Sign up now to view full answer, or log in if you already have an account!
Answer
Homologous chromosomes have a mixture of genetic material due to crossing over that occurs during prophase I of meiosis, allowing exchange of genetic material between paired chromosomes.
Step 17
Name the phase that will follow the one represented by DIAGRAM A.
97%
117 rated
Only available for registered users.
Sign up now to view full answer, or log in if you already have an account!
Answer
The phase that will follow the one represented by DIAGRAM A is Anaphase II.
Step 18
Describe the events that take place in the phase mentioned in QUESTION 2.5.3.
97%
121 rated
Only available for registered users.
Sign up now to view full answer, or log in if you already have an account!
Answer
During Anaphase II, the spindle fibers contract, separating the sister chromatids and pulling them toward opposite poles of the cell.
Step 19
Name ONE place in a human male where meiosis takes place.
96%
114 rated
Only available for registered users.
Sign up now to view full answer, or log in if you already have an account!
Answer
Meiosis takes place in the testes, specifically within the seminiferous tubules.