2.1
The diagram below represents the human male reproductive system - NSC Life Sciences - Question 2 - 2016 - Paper 1
Question 2
2.1
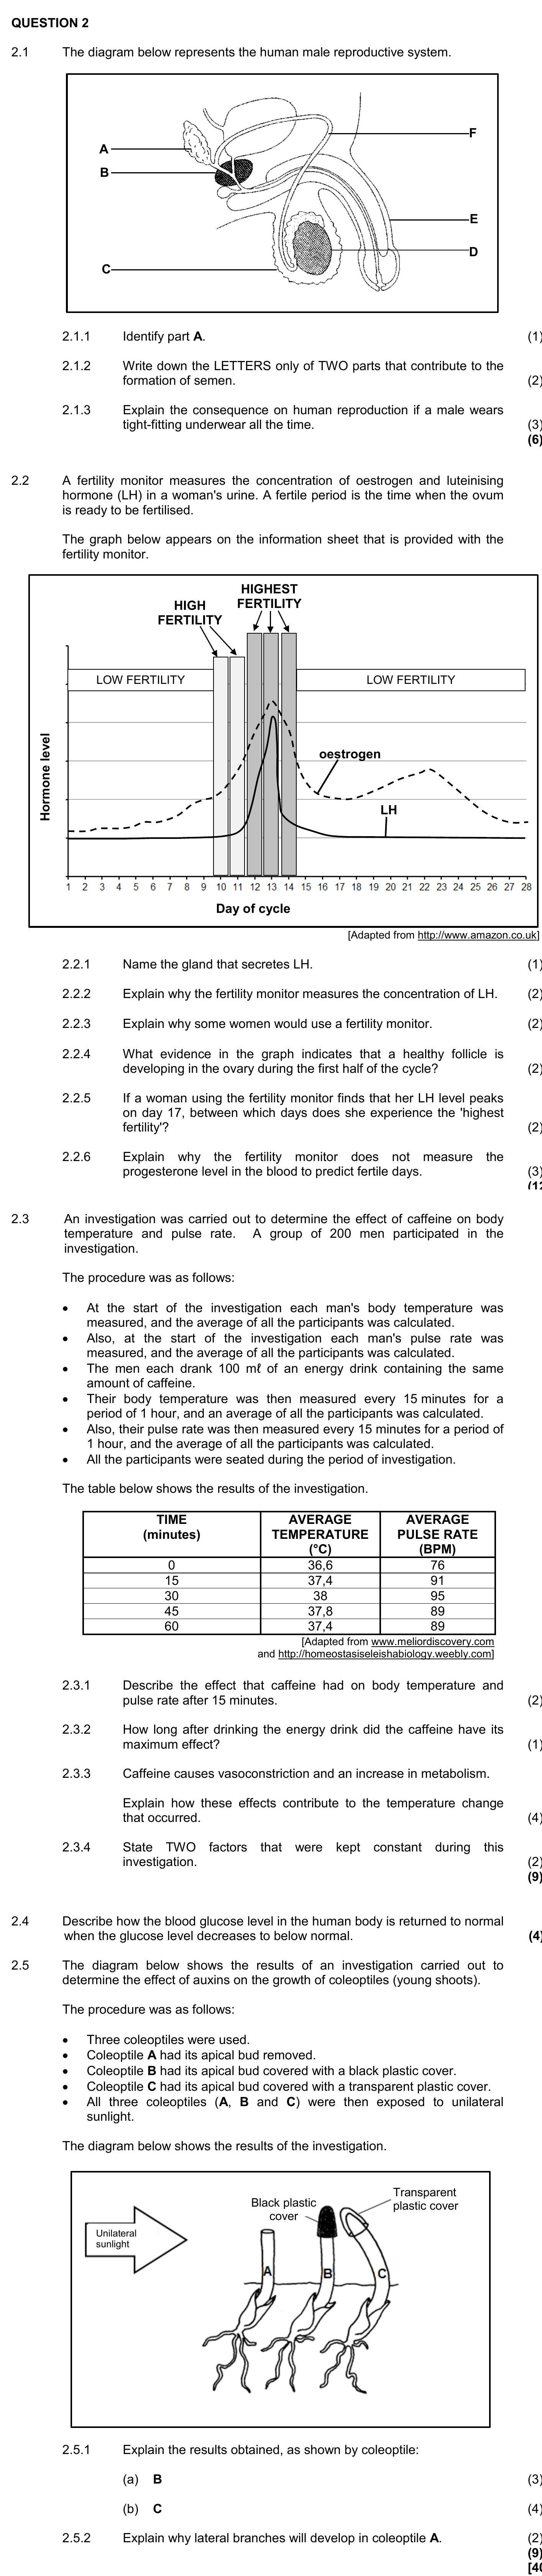
The diagram below represents the human male reproductive system.
2.1.1 Identify part A.
2.1.2 Write down the LETTERS only of TWO parts that contribute to the f... show full transcript
Worked Solution & Example Answer:2.1
The diagram below represents the human male reproductive system - NSC Life Sciences - Question 2 - 2016 - Paper 1
Step 1
Identify part A.
96%
114 rated
Only available for registered users.
Sign up now to view full answer, or log in if you already have an account!
Answer
Part A refers to the seminal vesicle, which is one of the glands responsible for producing a significant portion of the fluid that becomes semen.
Step 2
Write down the LETTERS only of TWO parts that contribute to the formation of semen.
99%
104 rated
Only available for registered users.
Sign up now to view full answer, or log in if you already have an account!
Answer
The two parts that contribute to the formation of semen are:
A (Seminal vesicles)
D (Prostate gland)
Step 3
Explain the consequence on human reproduction if a male wears tight-fitting underwear all the time.
96%
101 rated
Only available for registered users.
Sign up now to view full answer, or log in if you already have an account!
Answer
Wearing tight-fitting underwear consistently can lead to increased temperature in the scrotal area, which may adversely affect sperm production, leading to lower fertility rates. Elevated temperatures can denature proteins involved in sperm development, reducing the quality and quantity of sperm.
Step 4
Name the gland that secretes LH.
98%
120 rated
Only available for registered users.
Sign up now to view full answer, or log in if you already have an account!
Answer
The gland that secretes LH (Luteinising hormone) is the pituitary gland.
Step 5
Explain why the fertility monitor measures the concentration of LH.
97%
117 rated
Only available for registered users.
Sign up now to view full answer, or log in if you already have an account!
Answer
The fertility monitor measures the concentration of LH to identify peak fertility periods. High levels of LH indicate ovulation is imminent, signaling the best times for conception.
Step 6
Explain why some women would use a fertility monitor.
97%
121 rated
Only available for registered users.
Sign up now to view full answer, or log in if you already have an account!
Answer
Women may use a fertility monitor to track their ovulation cycle, which helps in planning for pregnancy or to avoid pregnancy. It provides reliable insights into fertile windows.
Step 7
What evidence in the graph indicates that a healthy follicle is developing in the ovary during the first half of the cycle?
96%
114 rated
Only available for registered users.
Sign up now to view full answer, or log in if you already have an account!
Answer
The evidence is shown by rising levels of oestrogen and LH during the first half of the cycle, indicating that a healthy follicle is maturing in the ovary.
Step 8
If a woman using the fertility monitor finds that her LH level peaks on day 17, between which days does she experience the highest fertility?
99%
104 rated
Only available for registered users.
Sign up now to view full answer, or log in if you already have an account!
Answer
If LH peaks on day 17, the highest fertility is typically experienced between days 15 and 17.
Step 9
Explain why the fertility monitor does not measure the progesterone level in the blood to predict fertile days.
96%
101 rated
Only available for registered users.
Sign up now to view full answer, or log in if you already have an account!
Answer
The fertility monitor does not measure progesterone levels to predict fertile days since progesterone rises after ovulation, which does not indicate the timing of ovulation itself and therefore the fertile period.
Step 10
Describe the effect that caffeine had on body temperature and pulse rate after 15 minutes.
98%
120 rated
Only available for registered users.
Sign up now to view full answer, or log in if you already have an account!
Answer
After 15 minutes, caffeine increased both body temperature and pulse rate, indicating a physiological response to the stimulant effect of caffeine.
Step 11
How long after drinking the energy drink did the temperature have its maximum effect?
97%
117 rated
Only available for registered users.
Sign up now to view full answer, or log in if you already have an account!
Answer
The maximum effect on temperature was observed at 30 minutes after drinking the energy drink.
Step 12
Explain how vasoconstriction and an increase in metabolism contribute to the temperature change that occurred.
97%
121 rated
Only available for registered users.
Sign up now to view full answer, or log in if you already have an account!
Answer
Vasoconstriction reduces blood flow to the skin, minimizing heat loss, which contributes to the increase in body temperature. Additionally, an increase in metabolism generates more heat, further raising body temperature.
Step 13
State TWO factors that were kept constant during this investigation.
96%
114 rated
Only available for registered users.
Sign up now to view full answer, or log in if you already have an account!
Answer
The two factors kept constant were:
The length of time when measurements were taken.
The type of energy drink consumed.
Step 14
Describe how the blood glucose level in the human body is returned to normal when the glucose level decreases to below normal.
99%
104 rated
Only available for registered users.
Sign up now to view full answer, or log in if you already have an account!
Answer
When blood glucose levels drop below normal, the pancreas secretes glucagon, which stimulates the liver to convert glycogen back into glucose. This process raises blood glucose levels back to normal.
Step 15
Explain the results obtained, as shown by coleoptile B.
96%
101 rated
Only available for registered users.
Sign up now to view full answer, or log in if you already have an account!
Answer
Coleoptile B, covered with a black plastic cover, does not receive light. As a result, the shoot grows straighter and does not bend toward the light since auxins distribute evenly and stimulate growth, but without the directional light stimulus, the plant does not gain the positive tropism.
Step 16
Explain the results obtained, as shown by coleoptile C.
98%
120 rated
Only available for registered users.
Sign up now to view full answer, or log in if you already have an account!
Answer
Coleoptile C, with a transparent cover, is exposed to light, allowing auxins to accumulate on the shaded side. Consequently, the shoot bends towards the light due to positive phototropism, resulting in uneven growth where the shaded side elongates more.
Step 17
Explain why lateral branches will develop in coleoptile A.
97%
117 rated
Only available for registered users.
Sign up now to view full answer, or log in if you already have an account!
Answer
Lateral branches develop in coleoptile A because removing the apical bud eliminates the primary growth point, allowing the lateral buds to become active. With the vertical growth inhibited, the lateral branches are stimulated to grow and fill the space.