Photo AI
Last Updated Sep 24, 2025
Perfect Markets and Graphs Simplified Revision Notes for NSC Economics
Revision notes with simplified explanations to understand Perfect Markets and Graphs quickly and effectively.
310+ students studying
Perfect Markets and Graphs
Definition and Characteristics of Perfectly Competitive Markets
- Perfectly Competitive Markets: A theoretical economic model characterised by a large number of small firms, each without the ability to affect market prices.
Characteristics
-
Large Number of Buyers and Sellers:
- Numerous participants ensure that no individual entity can dictate prices.
- Prices are established based on the collective activities of all market participants.
-
Homogeneous Products:
- All goods are identical across suppliers.
- This uniformity is essential to maintain fair competition.
Homogeneous Products: These are products that have consistent quality and features, making them substitutable for one another.
Example: Fast-food restaurants offering similar servings of chips.
- Free Market Entry and Exit:
- Firms can effortlessly enter or leave the market in response to profitability changes, without obstruction.
The Role of Perfect Information and Mobility of Factors
- Perfect Information:
- All entities have complete awareness of prices and quality levels.
- Example: Consumers leveraging comparison apps to examine product prices and attributes from multiple vendors.
Real-World Example: Websites and applications (e.g., shopping comparison tools) enhance transparency by showcasing price and feature comparisons.
- Mobility of Factors:
- Resources such as labour and capital can be swiftly reallocated within markets.
- Ensures efficient resource allocation, enabling supply adjustments to satisfy demand.
Example: Technology companies reallocating computing resources based on fluctuations in demand.
Assumptions Underlying Perfect Competition
-
Key Assumptions:
- Rational Behaviour: Participants strive to maximise utility and profits.
- Profit Maximisation: Firms pursue the attainment of the highest possible profit.
- No Governmental Intervention: The market operates independently of regulatory influences.
-
Implications:
- Self-correction occurs:
- Overproduction results in price declines, which reduce supply.
- Underproduction leads to price increases, attracting additional supply.
- Self-correction occurs:
Example: Rational behaviour involves selecting the most cost-effective purchase that provides desired benefits.
Common Misconceptions
-
Misunderstanding Price-Taking Behaviour:
- Firms lack influence over market prices; they adapt to the equilibrium price.
-
Product Homogeneity Issues:
- Errors occur when assuming product differentiation in markets characterised by uniformity.
Common Misconception: It is incorrect to assume that firms can set their own prices in a perfectly competitive environment.
Real-World Examples
- Agricultural Markets:
- Examples include:
- Wheat
- Dairy
- Other commodity products
- Maintain characteristics of perfect competition by ensuring a significant number of participants and uniform goods.
- Examples include:
Illustrated Scenario: The wheat market, exemplifying numerous farmers selling homogeneous wheat grains, all accepting prices set by market conditions unaffected by individual actions.
Caption: Homogeneous products and price-taking behaviour ensure equilibrium in competitive markets like agriculture.

Caption: Assumptions drive the self-correcting nature of these markets.
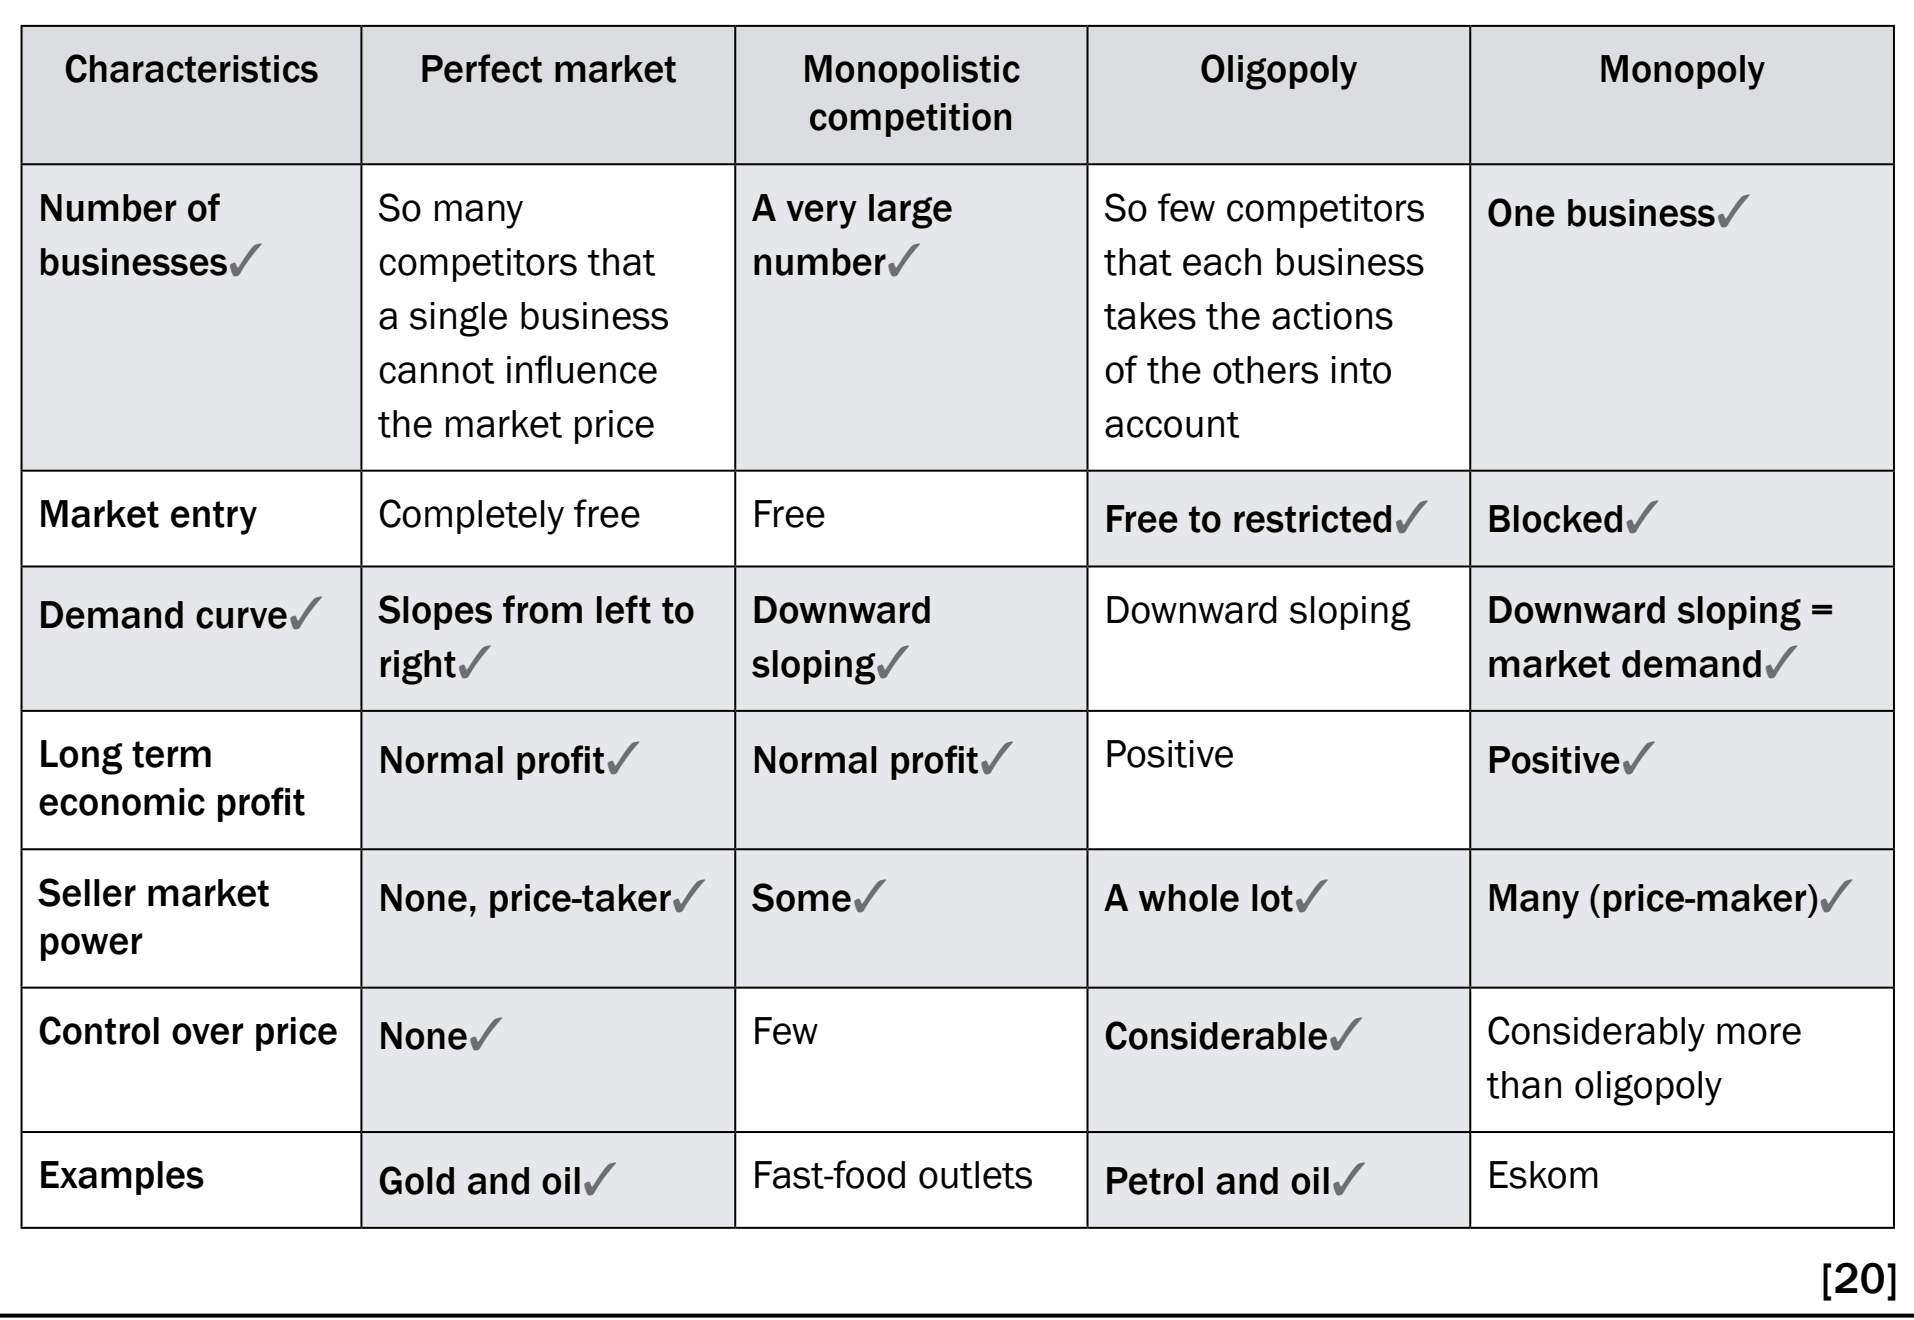
Caption: Contrast between perfect competition and other market forms emphasising differing pricing powers.
Introduction to Supply and Demand Curves
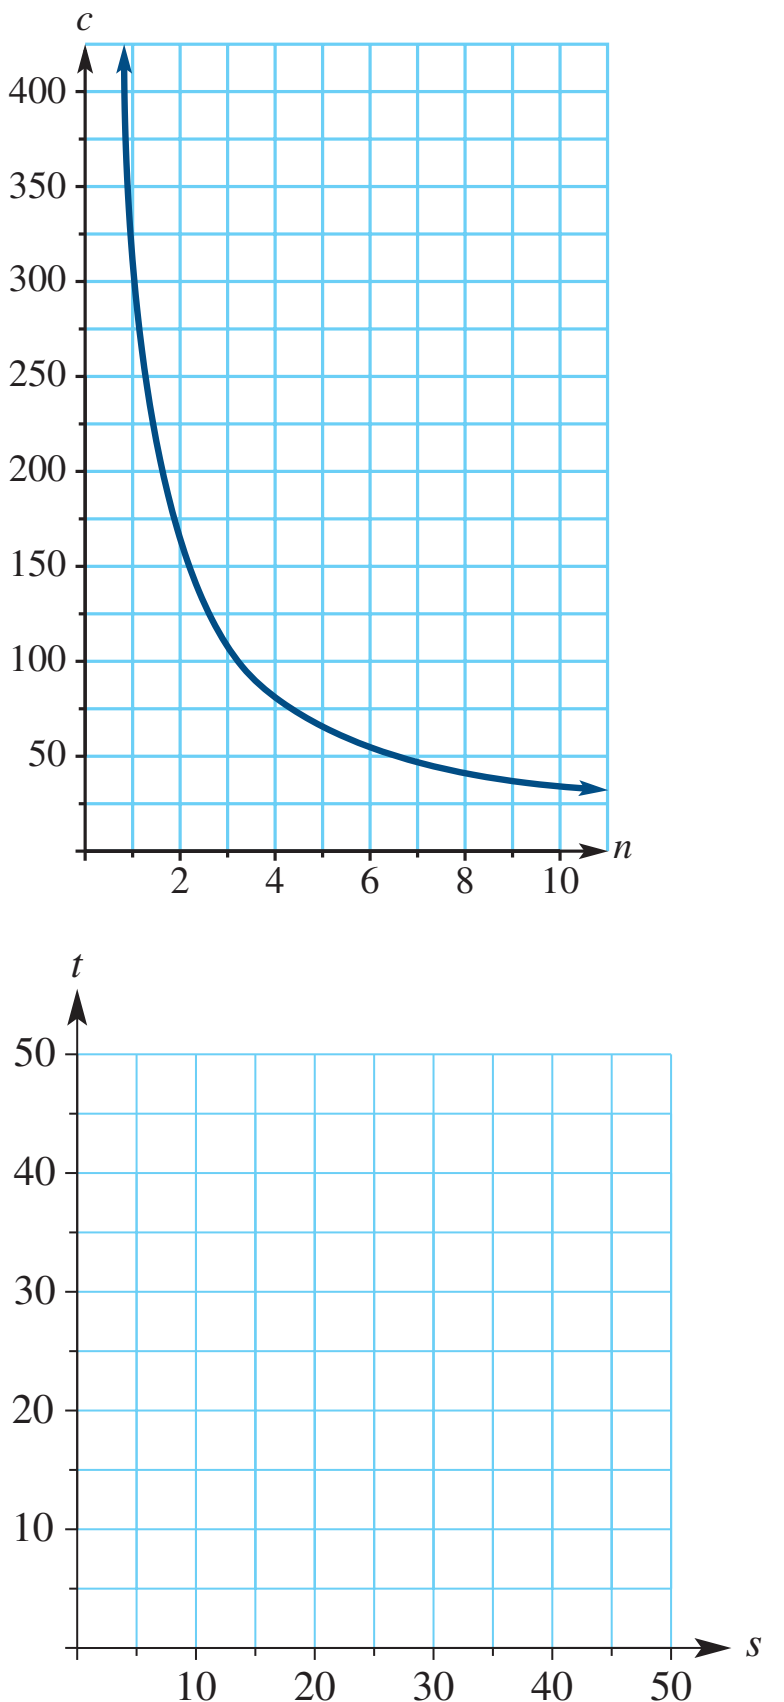
In economics, supply and demand curves graphically illustrate the relationship between price and quantity.
- Demand Curve: Indicates that lower prices lead to greater demand.
- Supply Curve: Demonstrates that higher prices incentivise increased supply.
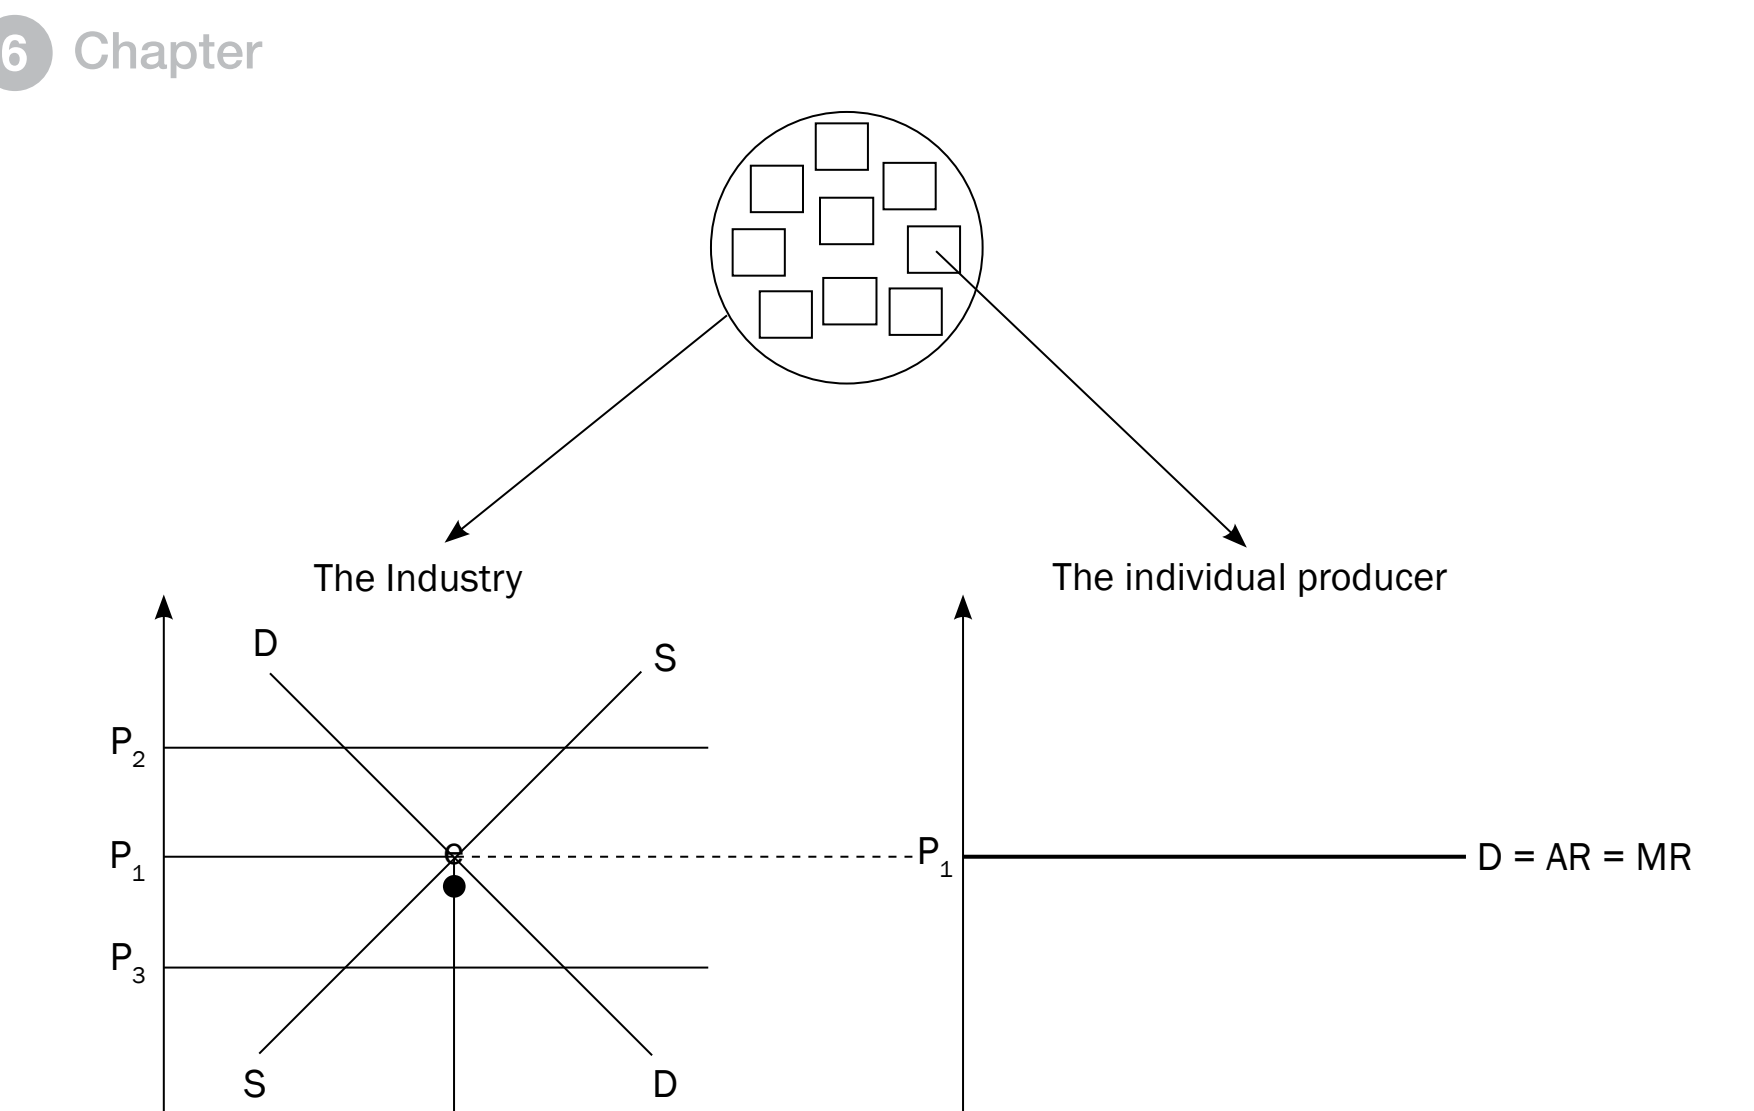
In a Perfectly Competitive Market, there are numerous buyers and sellers, identical products, and easy market entry or exit.
Perfectly Competitive Market: Characterised by numerous buyers/sellers, identical products, and free market entry/exit.
Factors Influencing Curves
Supply Curve Influences
- New technology: Accelerates production, enhancing supply.
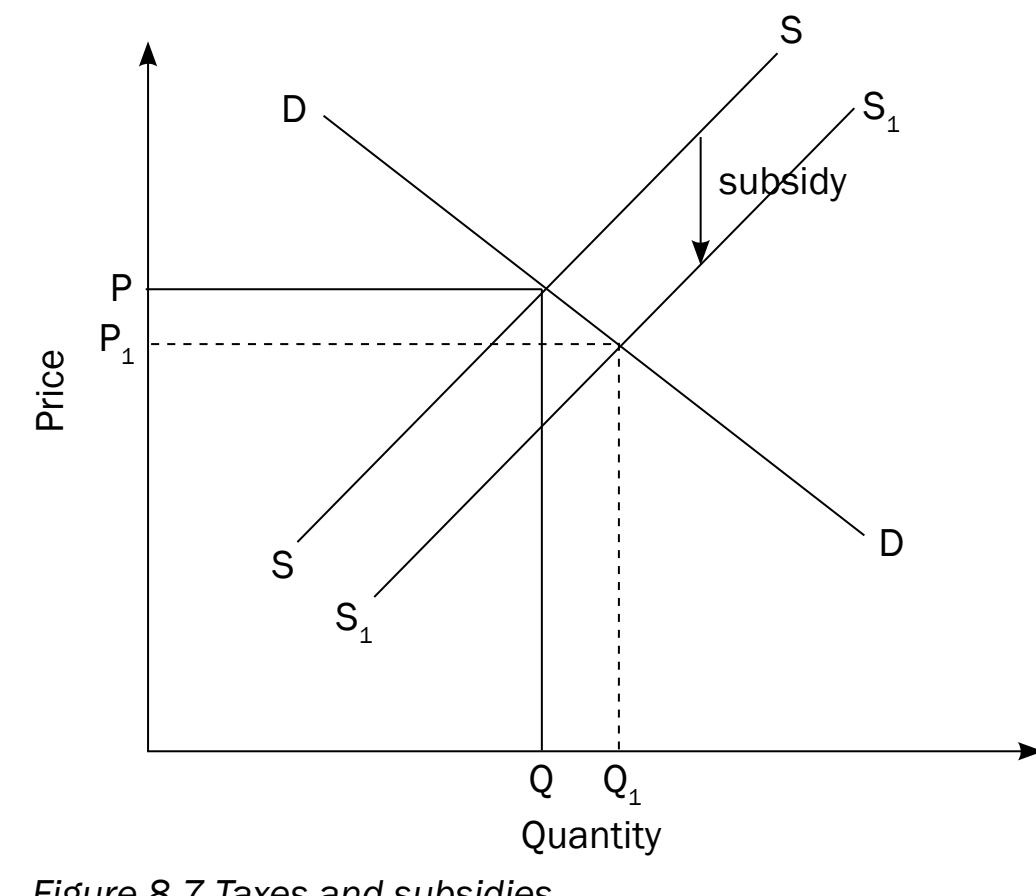
- Subsidies: Lower costs, increasing supply.
- Taxes: Raise expenses, decreasing supply.
Demand Curve Influences
- Consumer Income: Higher income results in greater demand.
- Prices of Substitutes: Affect demand for primary products.
Equilibrium in Perfect Markets
Market equilibrium is achieved where supply equals demand, establishing a balanced price.
Example: The coffee market reaches equilibrium when supply aligns with consumer demand. Consider how a cold winter affects coffee demand, thereby impacting equilibrium.
Shifts vs. Movements Along Curves
- Movements: Triggered by price changes.
- Shifts: Result from non-price factors such as technological advances.
Shifts in Curves: Caused by external factors (e.g., technology), leading to the entire curve moving.
Avoiding Common Graphical Mistakes
- Steps:
- Ensure price is on the Y-axis, quantity on the X-axis.
- Always verify axis labels with examples from your notes.
Short-Run Equilibrium in a Perfect Market
Introduction to Short-Run Equilibrium
Short-Run Equilibrium: This occurs when a firm's supply meets consumer demand at a specific price level, with some inputs remaining fixed.
- Nature: A temporary state distinct from long-run equilibrium.
- Fixed Costs: Remain unchanged regardless of output adjustments.
- Variable Costs: Fluctuate based on output levels.
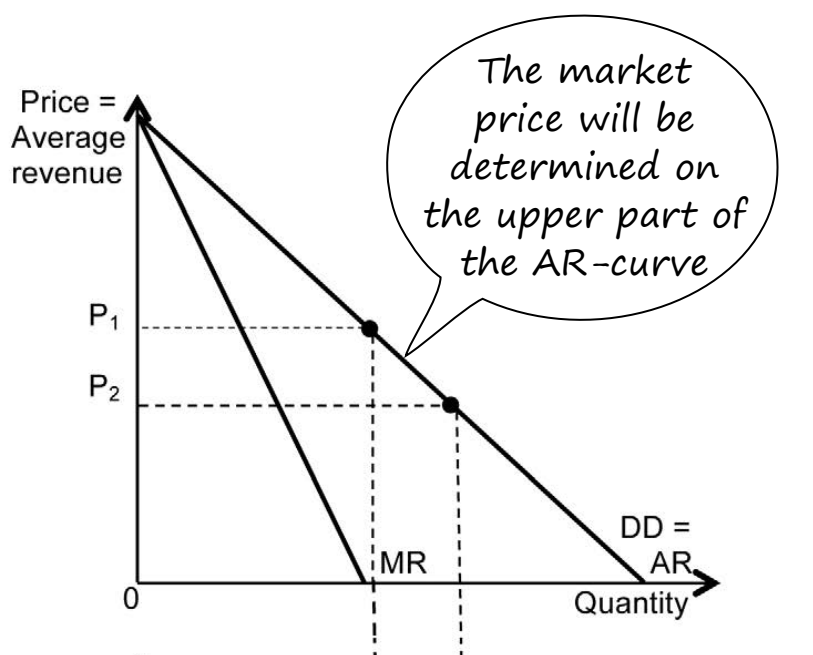
To determine equilibrium, firms assess their average revenue (AR) and marginal revenue (MR) in conjunction with related costs.
Short-Run: Refers to the period where at least one input, such as machinery, remains constant.
Graphical Representation of Short-Run Equilibrium
Guidelines for Graphing
- Step 1: Plot Average Revenue (AR) and Marginal Revenue (MR).
- Step 2: Add Average Total Cost (ATC) and Marginal Cost (MC).
- Step 3: Identify the point where MR=MC; this determines equilibrium output and pricing.
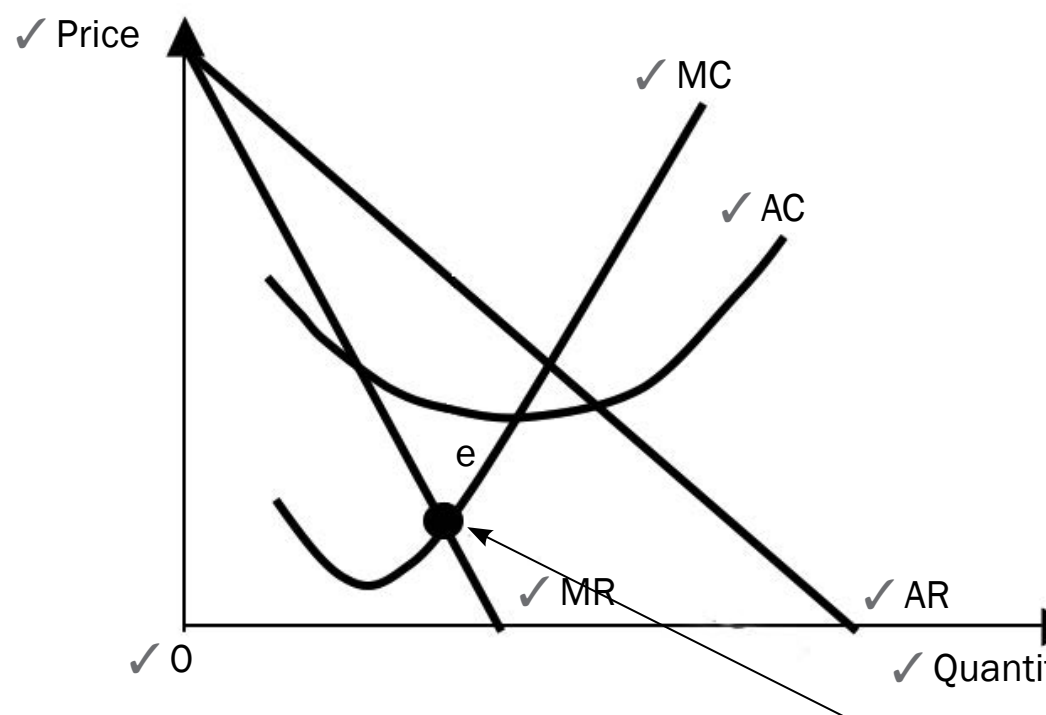
Profit-Maximisation Condition (MR=MC)
- Profit-Maximisation Rule: A firm maximises its profit when MR = MC. This reflects the optimal output for maximum efficiency.
- Economic Outcomes:
- Economic Profits:
- Break-Even:
- Economic Losses:
The principle of MR=MC is crucial for analysing firm behaviour and is frequently examined in tests.
Economic Observations and Case Studies
- Profit Scenarios: Achieved when , indicating profit beyond operational costs.
- Break-Even Points: Occur when , equating total revenues with total costs.
- Loss Indications: Identified when , leading to financial losses.
Case Studies
-
Ice-Cream Business
- In peak season: , optimising profits.
- During off-season: , incurring losses.
- Equal revenues and costs: Break-even situation.
-
Café with Variable Demand
- High-traffic times: , maximising profits.
- Slow periods: May result in break-even or losses, depending on fixed costs.
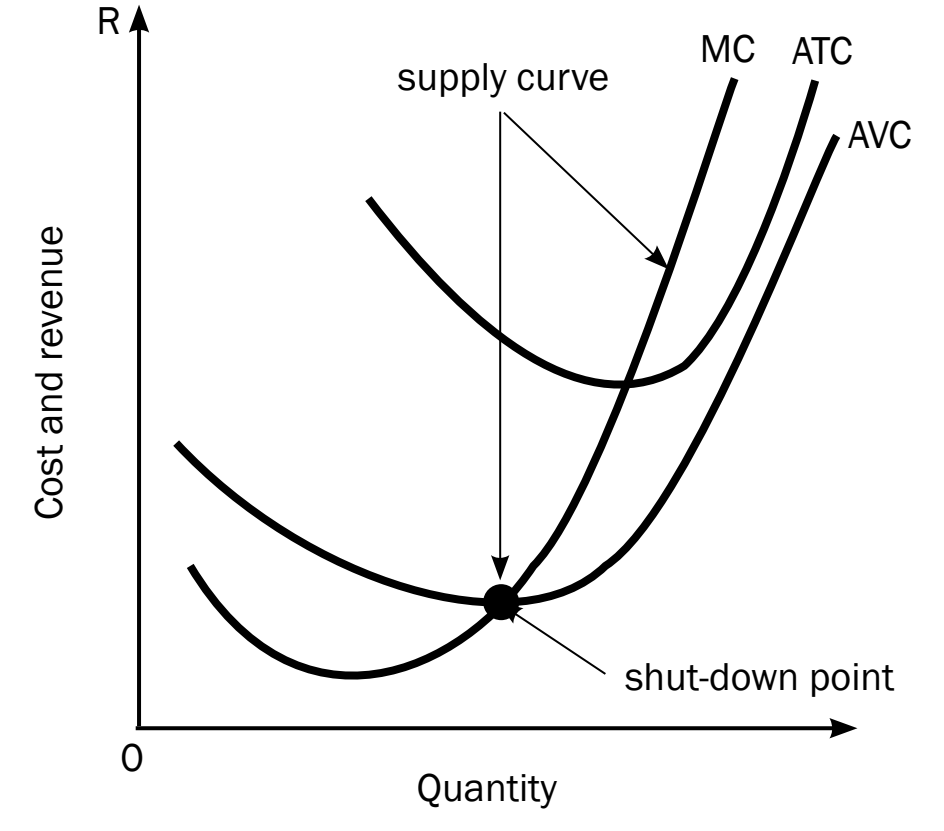
Common Misunderstandings and Tips
- Misinterpretation of MR=MC can frequently lead to errors.
Graphing Tips
- The MC curve should intersect MR from below for accurate representation.
- Always label curves accurately to prevent confusion.
Long-Run Equilibrium in a Perfect Market
Definition and Characteristics of Long-Run Equilibrium
- Long-Run Equilibrium: Occurs when firms realise zero economic profit in a perfectly competitive market.
- Productive Efficiency: Firms produce at the lowest point on their long-run average cost curve (LRAC).
- Allocative Efficiency: Resources are employed to maximise consumer satisfaction, aligning price with marginal cost (P = MC).
- Total revenue matches total costs, inclusive of opportunity costs, ensuring normal profit.
Long-Run Equilibrium: A key state where firms achieve zero economic profit, optimising resources and productivity.
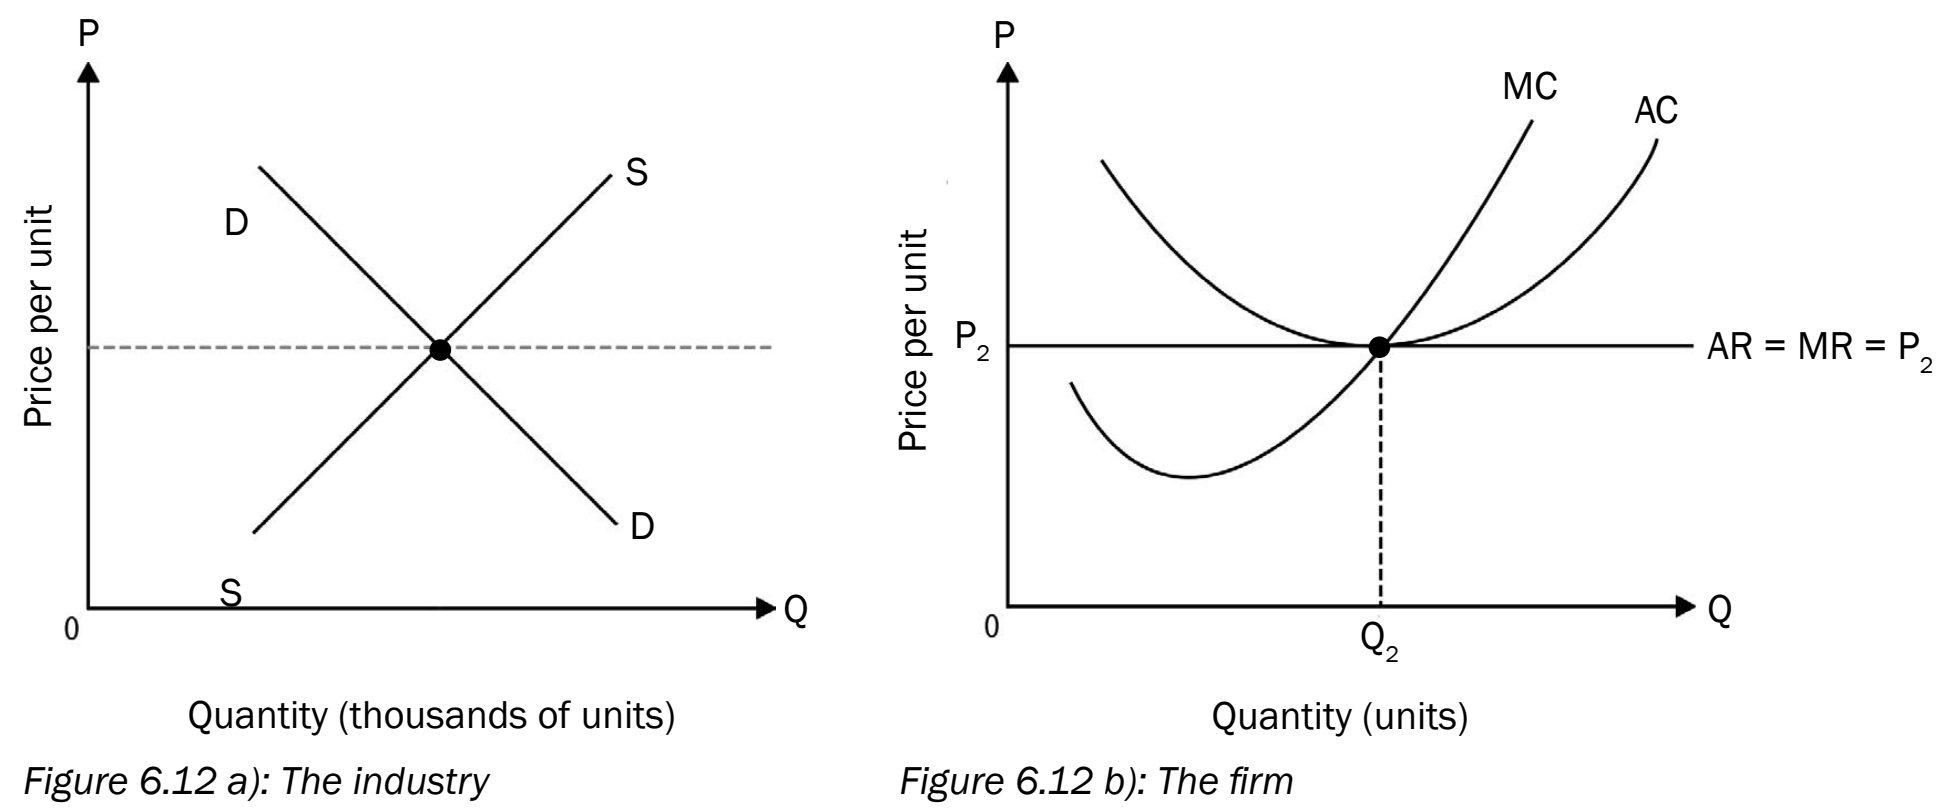
Graphical Depiction of Long-Run Equilibrium
- Long-run equilibrium is shown at the intersection of the long-run average cost curve (LRAC) and marginal cost (MC) with market price.
- Firms reach productive efficiency by producing at the minimum point on the LRAC.
- The long-run supply curve is perfectly elastic, reflecting that any demand change is met by output variation, not price changes.
This diagram illustrates how firms achieve long-run equilibrium by matching their LRAC with market conditions.
Market Dynamics - Entry and Exit of Firms
- Entry of Firms: Draws new businesses due to short-term supernormal profits, boosting supply and lowering prices to normal profit levels.
- Exit of Firms: Happens when firms suffer losses; exiting reduces supply, causing price rises to restore normal profits.
This showcases the inherent self-correcting ability of a perfectly competitive market.
Industry Graphs and Adjustment Towards Normal Profit
- Changes in industry supply curves occur as technological and market conditions evolve.
- Supply Curve Adjustment: Reflects shifts due to firm entries/exits and technological advancements impacting equilibrium.
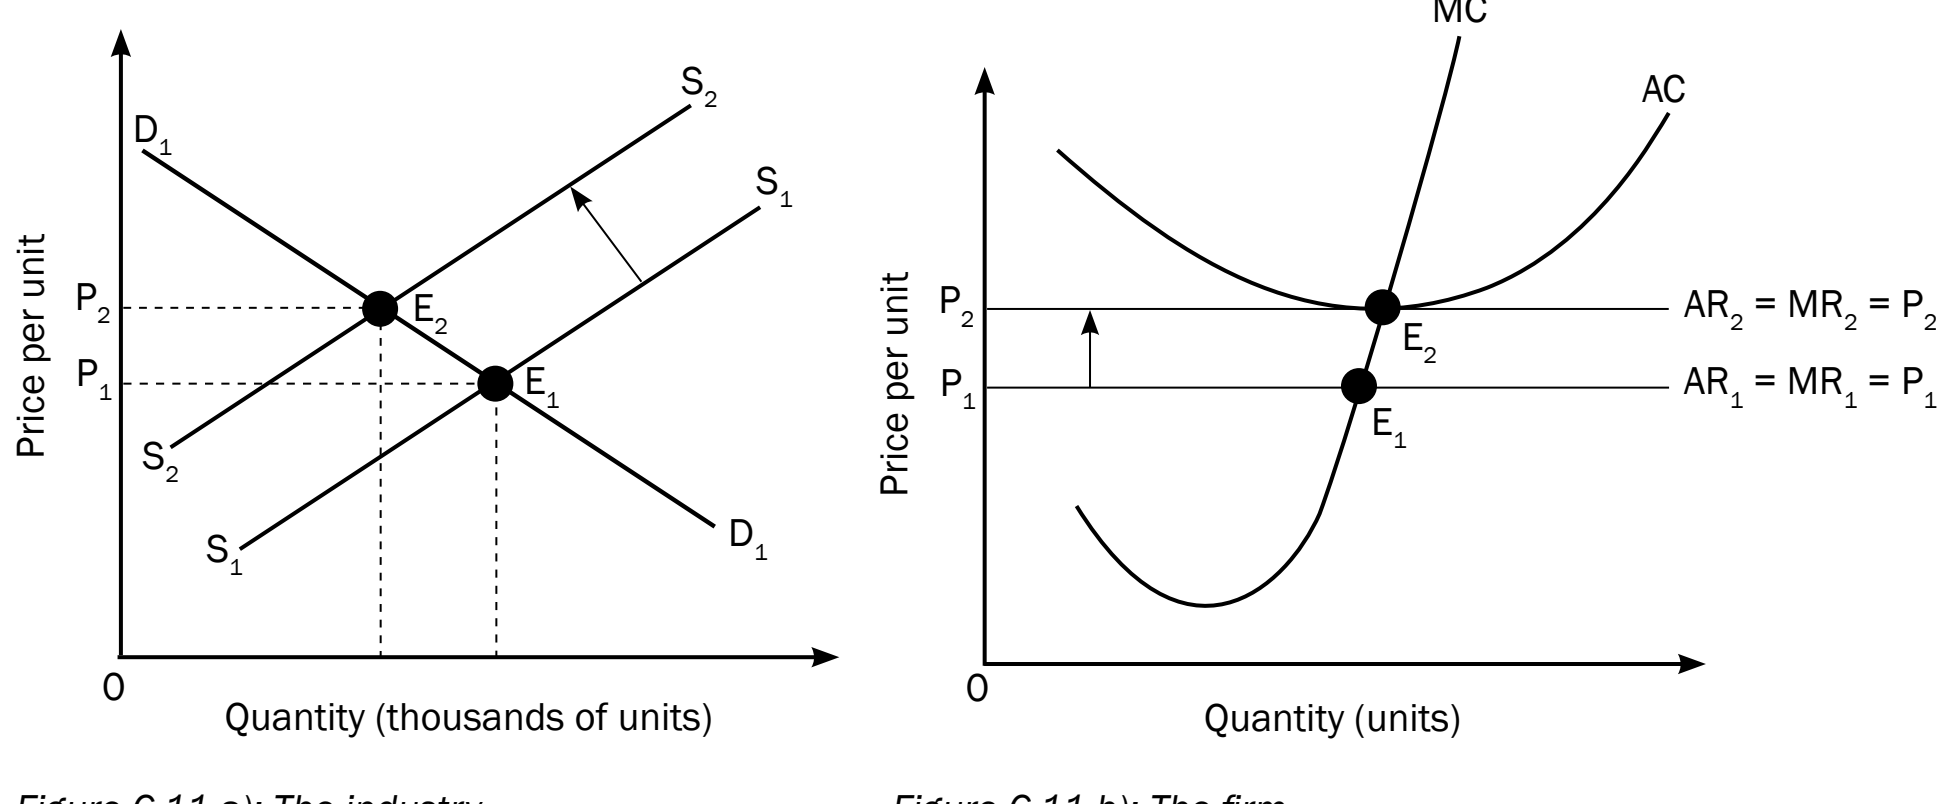
Factors Leading to Long-Run Equilibrium
- The removal of economic profits/losses guides markets to equilibrium, ensuring efficient resource use.
Real-World Examples for Contextual Insight
- Agricultural Markets: High profits prompt increased supply until normal profits are achieved.
- Technology Markets: Initial high prices for new products spur competition, driving prices to normal levels.
- Example: A new smartphone model, initially priced high due to demand, attracts competitors, increasing supply until prices stabilise.
Summary and Key Takeaways
- Long-run equilibrium ensures firms achieve zero economic profit, aligning with productive and allocative efficiency.
- Markets self-correct through the dynamics of entry and exit.
- Changes in industry supply curves arise from market and technological developments.
- Real-world examples from agriculture and technology demonstrate practical implications.
Impact of Cost and Revenue Changes on Equilibrium
This section examines how variations in costs and revenues impact equilibrium in perfectly competitive markets. Use diagrams to comprehend supply and demand interactions.
Key Concepts
-
Market Equilibrium: The point where supply and demand curves intersect determines the market price and quantity.
infoNoteMarket Equilibrium: The point where the quantity supplied equals the quantity demanded.
-
Supply Curve: A graph depicting quantities supplied at varying prices.
infoNoteSupply Curve: Represents the quantities suppliers are prepared to sell at different price levels.
-
Demand Curve: A graph illustrating quantities demanded at assorted prices.
infoNoteDemand Curve: Shows the amounts consumers wish to purchase at various prices.
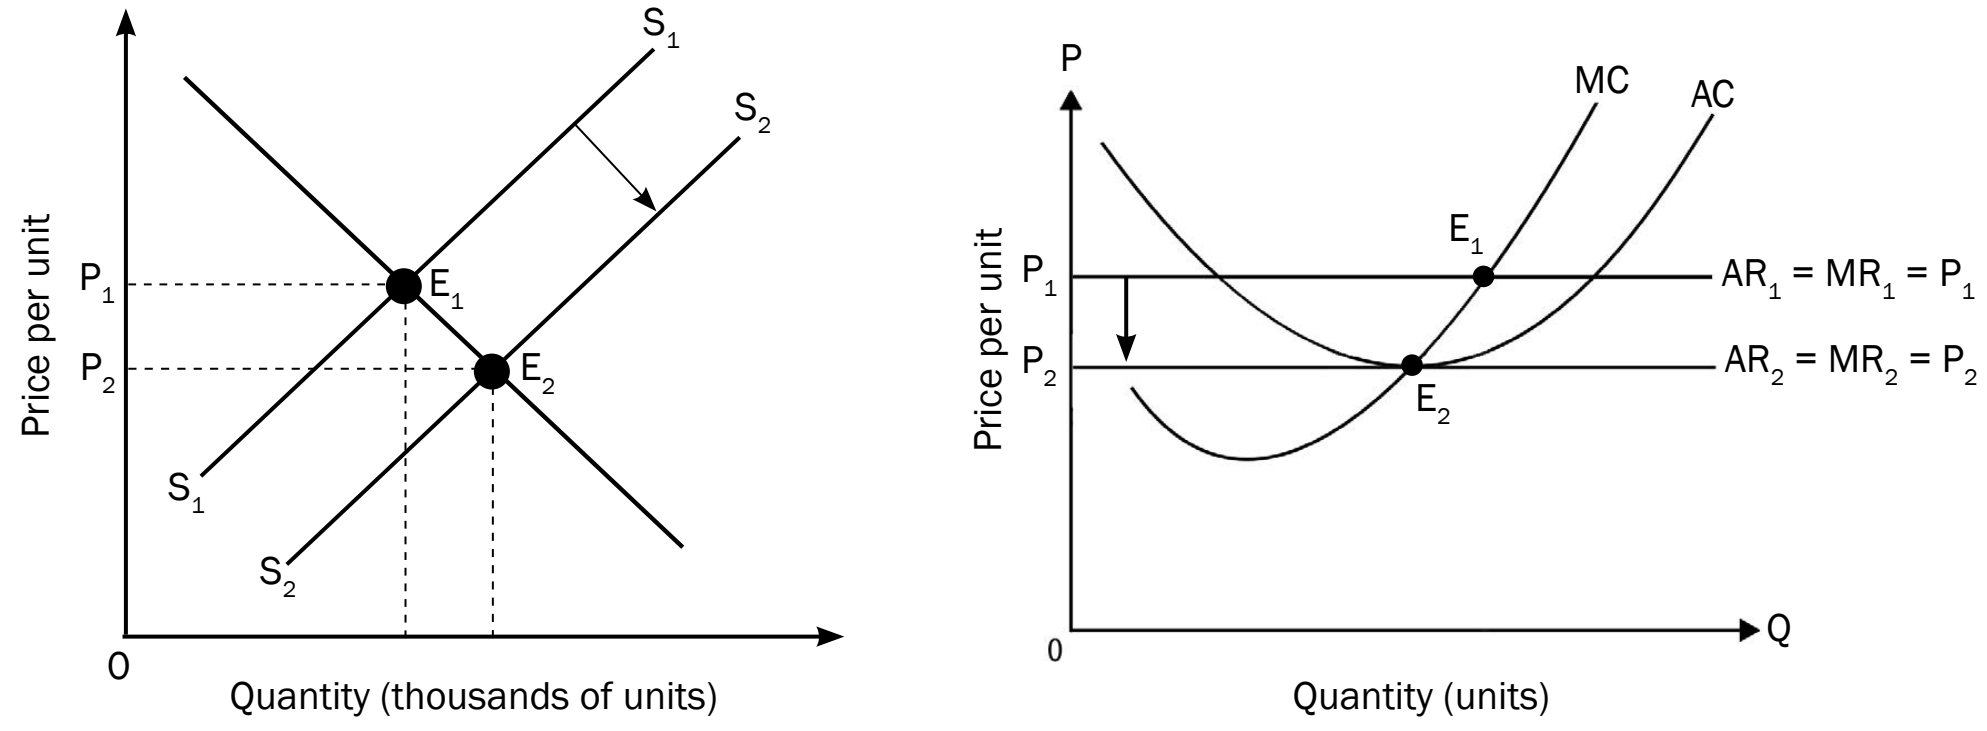
Impact of Cost Changes
Variable Costs
- An increase in variable costs shifts the supply curve leftward.
- Prices rise, quantities fall.
- Example: Increasing labour costs.
Variable Costs: Costs that vary with production. These can quickly influence supply dynamics.
Fixed Costs
- Fixed costs do not immediately affect supply but can influence long-term strategic decisions.
- Example: Factory rent, which remains stable in the short term.
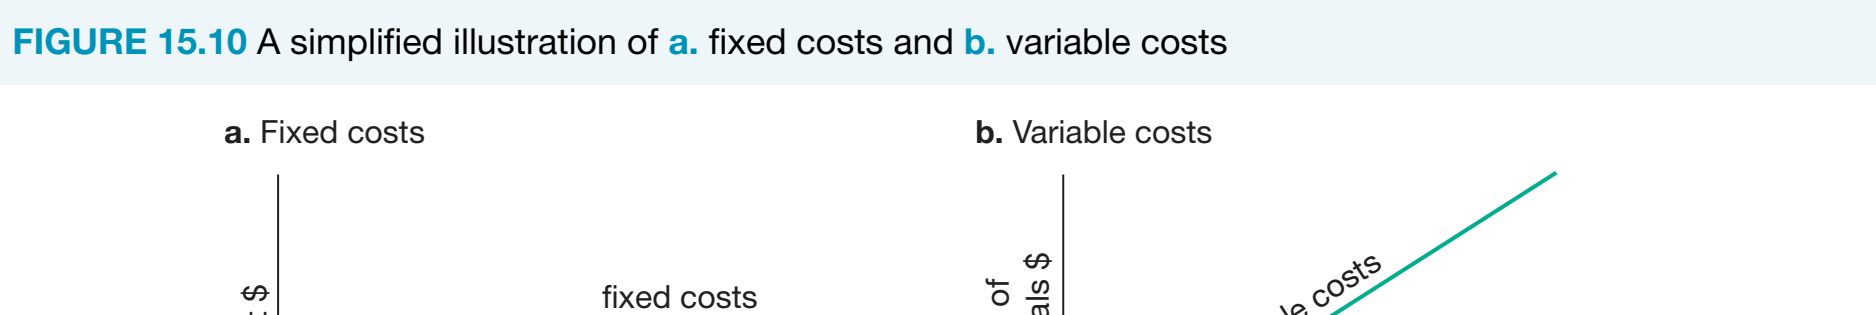
Fixed Costs: Costs that remain unchanged by production levels initially, yet play a significant role in long-term strategy.
Impact of Revenue Changes
- An increase in revenue shifts the demand curve to the right, resulting in higher equilibrium prices and quantities.
- Example: Rising consumer income increases demand.
Graphical Representation of Shifts
Demand Changes
- Alterations in consumer preferences can cause the demand curve to shift rightward.
Simultaneous Shifts
- Simultaneous shifts in supply and demand curves create a new equilibrium point. The outcome depends on the magnitude of these shifts.
Practical Examples
Consider this scenario:
- Initial Situation: Price at £10, quantity at 100 units.
- Change: Supply curve shifts left due to rising costs.
- New Equilibrium: Price at £12, quantity reduces to 90 units.
Example Calculation: Analyse how price and quantity adjust due to changes in cost or revenue conditions.
Exam Tips
- Mnemonic: Remember "VIC" for Variable = Immediate Change.
- Practice interpreting graphs to identify equilibrium shifts.
- Understand cause-and-effect relationships to predict market responses.
Typical Student Errors
Common Errors in Graph Interpretation:
- Axis Mislabelling: Confusion between price and quantity axes.
- Curve Plotting Errors: Incorrect curve plotting due to misunderstanding the quantity-price relationship.
- Misinterpreting Shifts vs. Movements: Confusing shifts in curves with movements along curves.
-
Axis Mislabelling:
- Definition: Mismatching x-axis and y-axis leads to incorrect graph interpretations.
- Diagram demonstration clarifies the significance of correct axis labelling.
-
Curve Plotting Errors:
- Definition: Errors in curve plotting arise from misunderstanding how quantity changes relate to price changes.
- Impact: Incorrect plots can suggest inappropriate market conditions.
-
Misinterpreting Shifts vs. Movements:
- Definition: Confusing external factor-induced shifts (e.g., consumer preferences) with movements along the curve due to price changes.
Strategies to Avoid Errors
-
Mnemonic Devices:
- Use expressions like "Price to the sky, Quantity to the side" to aid in remembering axis labels.
-
Guided Practice:
- Engage in step-by-step exercises for consistent accuracy.
- Exercise: Label axes and plot curves repeatedly until errors diminish.
- Engage in step-by-step exercises for consistent accuracy.
-
Visual Aids and Interactive Tools:
- Colour-coded graphs assist in distinguishing interpretation errors.
- Interactive tools foster understanding of shifts versus movements.
Worked Examples
Example 1: Correct Graph Setup
- Objective: Proper labelling and identification of common errors.
Example 2: Demand Curve Shift
- Steps: Descriptive steps showing shifts in demand due to external factors.
- Scenario: Changes in consumer preferences alter demand levels.
- Steps: Evaluate initial equilibrium, apply the factor, observe the shift.
Definitions Callout Box
- Demand Curve: A graph showing the quantity of a product consumers are willing to purchase at varying price levels.
- Shift: Deviations in the demand or supply curve resulting from external factors.
- Movement: Refers to changes along the curve itself due to price variations.
With these strategies and examples, students can enhance their graphical interpretation skills, leading to improved comprehension and exam success.

500K+ Students Use These Powerful Tools to Master Perfect Markets and Graphs For their NSC Exams.
Enhance your understanding with flashcards, quizzes, and exams—designed to help you grasp key concepts, reinforce learning, and master any topic with confidence!
290 flashcards
Flashcards on Perfect Markets and Graphs
Revise key concepts with interactive flashcards.
Try Economics Flashcards32 quizzes
Quizzes on Perfect Markets and Graphs
Test your knowledge with fun and engaging quizzes.
Try Economics Quizzes13 questions
Exam questions on Perfect Markets and Graphs
Boost your confidence with real exam questions.
Try Economics Questions12 exams created
Exam Builder on Perfect Markets and Graphs
Create custom exams across topics for better practice!
Try Economics exam builder71 papers
Past Papers on Perfect Markets and Graphs
Practice past papers to reinforce exam experience.
Try Economics Past PapersOther Revision Notes related to Perfect Markets and Graphs you should explore
Discover More Revision Notes Related to Perfect Markets and Graphs to Deepen Your Understanding and Improve Your Mastery
96%
114 rated
The Dynamics of Perfect Markets
Perfect Markets and Competition
275+ studying
186KViews96%
114 rated
The Dynamics of Perfect Markets
Economics - Competition Policies
362+ studying
183KViews96%
114 rated
The Dynamics of Perfect Markets
The Dynamics of Perfect Markets
326+ studying
192KViews