Photo AI
Last Updated Sep 13, 2025
Continuous and discrete graphs Simplified Revision Notes for NSC Mathematical Literacy
Revision notes with simplified explanations to understand Continuous and discrete graphs quickly and effectively.
392+ students studying
Continuous and discrete graphs
1. Understanding Continuous and Discrete Graphs
Graphs can be classified as continuous or discrete, depending on the type of data they represent.
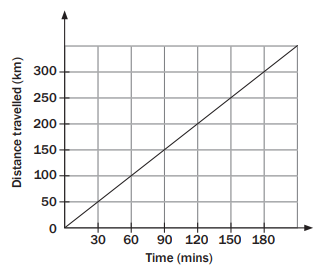
Continuous Graphs
- Represent measurements (e.g., time, distance, weight).
- Can have decimal values (e.g., 2.5 kg, 3.8 minutes).
- Plotted with solid lines to show that values between points are included.
- Example: A graph showing the distance travelled over time.
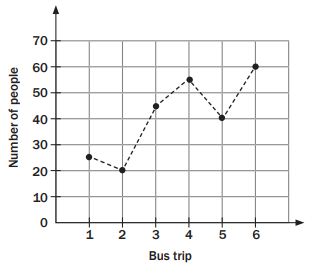
Discrete Graphs
- Represent countable quantities (e.g., number of people, number of items sold).
- Only whole numbers are used (e.g., 1 person, 2 necklaces).
- Plotted with dotted lines or separate points, as values between points do not exist.
- Example: A graph showing the number of passengers on a bus trip.
Tips:
- Measurements → Continuous Graphs
- Countable values → Discrete Graphs
2. Worked Example: Interpreting a Graph
A shop tracks the sales of necklaces over a week.
Key Questions & Answers:
- On which day were the most necklaces sold?
- Tuesday (17 necklaces).
- On which day were no sales made?
- Sunday (no shopping).
- Between which two days was the biggest sales increase?
- Monday to Tuesday (8 to 17, increase of 9).
- Between which two days did sales stay the same?
- Thursday to Friday.
- Why is this graph a discrete graph?
- Necklaces are sold in whole numbers, not fractions.
3. Activity: Analysing a Graph
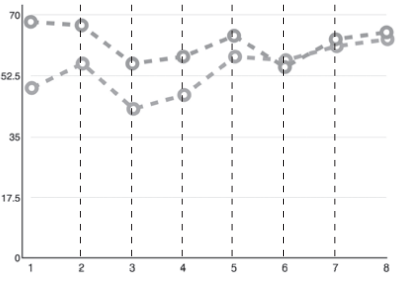
A student, Buhle, graphs her English and Mathematical Literacy marks over several tests.
Key Observations:
- Highest mark: 68-70% (Mathematical Literacy).
- Stronger subject: Mathematical Literacy.
- Trend over time: Overall, results are declining.
- Misleading graph elements: The scale of axes may exaggerate changes.
4. Key Takeaways
- Continuous Graphs: Represent measurements (solid lines).
- Discrete Graphs: Represent whole numbers (dotted lines).
- Interpreting graphs helps in understanding trends, comparisons, and patterns.

500K+ Students Use These Powerful Tools to Master Continuous and discrete graphs For their NSC Exams.
Enhance your understanding with flashcards, quizzes, and exams—designed to help you grasp key concepts, reinforce learning, and master any topic with confidence!
30 flashcards
Flashcards on Continuous and discrete graphs
Revise key concepts with interactive flashcards.
Try Mathematical Literacy Flashcards4 quizzes
Quizzes on Continuous and discrete graphs
Test your knowledge with fun and engaging quizzes.
Try Mathematical Literacy Quizzes29 questions
Exam questions on Continuous and discrete graphs
Boost your confidence with real exam questions.
Try Mathematical Literacy Questions27 exams created
Exam Builder on Continuous and discrete graphs
Create custom exams across topics for better practice!
Try Mathematical Literacy exam builder64 papers
Past Papers on Continuous and discrete graphs
Practice past papers to reinforce exam experience.
Try Mathematical Literacy Past PapersOther Revision Notes related to Continuous and discrete graphs you should explore
Discover More Revision Notes Related to Continuous and discrete graphs to Deepen Your Understanding and Improve Your Mastery
Load more notes