Photo AI
Last Updated Sep 13, 2025
False positives and false negatives Simplified Revision Notes for NSC Mathematical Literacy
Revision notes with simplified explanations to understand False positives and false negatives quickly and effectively.
500+ students studying
False positives and false negatives
1. Understanding False Positives and False Negatives
Tests (e.g. medical tests, drug tests, pregnancy tests) are not 100% accurate.
- A test result can be correct or incorrect.
- Two types of incorrect results:
- False Positive: The test incorrectly says the condition is present.
- False Negative: The test incorrectly says the condition is not present.
Example: Drug Testing in Sports
- Athletes undergo drug tests using Sample A.
- If Sample A tests positive, they can request Sample B testing to confirm the result.
- Example Case:
- A Comrades Marathon winner tested positive in Sample A.
- Later, Sample B showed that the result was incorrect, clearing the athlete of wrongdoing. | Test Result | Reality: YES (Drug present) | Reality: NO (No drug present) | |---|---|---| | Yes (Positive) | Correct | False Positive | | No (Negative) | False Negative | Correct |
Key Point: Even accurate tests can sometimes give incorrect results.
2. Probability of Incorrect Test Results
Most tests have a high accuracy rate, but errors still occur.
Example: Test Accuracy of 95%
- Accuracy = 95%
- Error Rate = 5% (0.05 probability of a mistake)
- If Sample A gives a false positive, the chance that Sample B is also incorrect is very unlikely.
Worked Example: Virus Testing
- A quick test detects a virus with a 0.4% false positive rate (4 out of 1 000 people who do not have the virus test positive).
- A more accurate laboratory test is used to confirm positive results.
Probability Calculations
- Chance of a false positive = 0.4% = 4 out of 1 000 people.
- For a group of 3 000 people: 4/1 000 × 3 000 = 12 false positives.
- In a group of 995 000 people who do not have the virus, 2 630 tested positive incorrectly.
- Probability of a false positive = 2 630 / 995 000 = 0.3%. Why Use a Second Test?
- The laboratory test is more accurate but takes longer and is more expensive.
- It is used only to confirm positive results, reducing the chance of false positives.
Activity 1: False positives and false negatives
Extract 1: Positive Drug Test (2012)
- Mamabolo won the Comrades Marathon but tested positive for a banned stimulant in both Sample A and Sample B.
- He faced a doping charge and risked losing his title.
Extract 2: Found Not Guilty (2013)
- 10 months later, Mamabolo was cleared of all charges due to irregularities in the testing process.
- 15 testing errors were identified, proving the test results were unreliable.
- His B-sample confirmed the presence of a banned substance, but the errors in testing procedures meant he was not guilty.
Extract 3: Testing Improvements
- Following this case, the Comrades Marathon Association improved its drug testing procedures to ensure more accurate results in future races.
Questions & Solutions
a) Probability of a False Positive with 95% Accuracy
- Accuracy = 95%, so the chance of an incorrect result (false positive or false negative) is 5% (0.05).
b) Probability of Two Consecutive False Positives
- If the test is 95% accurate, the chance of one false positive is 5% (0.05).
- The probability of two incorrect results in a row (Sample A & B both being false positives):
- Answer: Very unlikely (but not impossible).
c) Can We Be 100% Certain Mamabolo Did Not Take Drugs?
No, because:
- Testing errors occurred.
- False positives exist (though rare).
- No test is 100% accurate.
Activity 2 : Mixed questions about probability
1. Understanding Lightning Fatalities in South Africa
- More than 260 people die from lightning each year in South Africa.
- Data is based on Statistics SA (1999-2007), where 2,375 lightning deaths were recorded.
- Eastern Cape had the highest fatalities, followed by KwaZulu-Natal.
- Mpumalanga & Limpopo had lower risks, while Northern & Western Cape had the lowest incidences.
2. Questions & Solutions
a) Data Source for Lightning Deaths
Statistics South Africa provided the data.
b) How Was the Average of 260 Deaths Calculated?
Total deaths = 2,375 (1999-2007)
Years = 9
Calculation:
c) Type of Statistic Used?
The Mean (Average).
d) Adjusting for Under-Reporting (3,000 Total Deaths)
New Mean Calculation:
e) Were Deaths Equally Spread Among Provinces?
No, some provinces had much higher risks (e.g. Eastern Cape & KZN).
f) How Were Provinces Ranked for Risk?
By total number of lightning fatalities per province.
The report did not adjust for population size.
g) Comparing Two Risk Scenarios
Scenario A: 100 deaths in a province with 10,000,000 people
Scenario B: 20 deaths in a province with 1,000,000 people
Scenario B has a higher probability of death.
Activity 3 : Mixed questions about probability
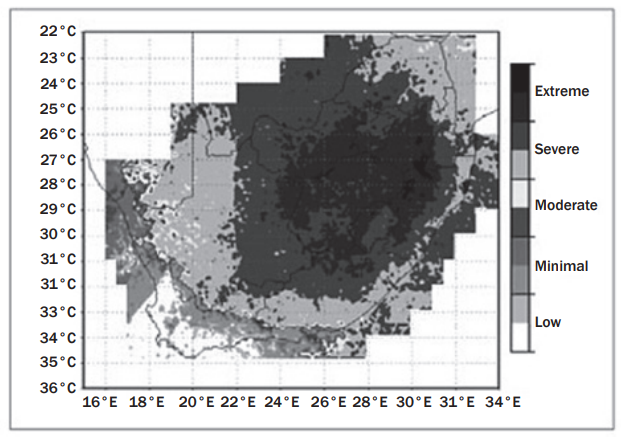
1. Understanding Lightning Risk Data
- Before 2006, the SA Weather Service (SAWS) could not measure lightning activity across South Africa.
- This changed with the installation of the SA Lightning Detection Network (SALDN), which provided scientific measurements of lightning density.
- Data analysis showed:
- High lightning concentration over the central and northern interior.
- Extreme risk near the northern escarpment (KwaZulu-Natal to Mpumalanga Lowveld).
- Decreasing risk towards the south of the country.
2. Questions & Solutions
a) Comparing Data Sources in Articles 1 & 2
| Article 1 (Question 1) | Article 2 (This Question) |
|---|---|
| Data is from reported lightning deaths over 9 years. | Data is from measured lightning density using SALDN. |
| Source: Statistics South Africa (1999-2007). | Source: SA Lightning Detection Network (since 2006). |
Article 2 is based on scientific lightning measurements, while Article 1 used reported deaths.
b) Why the Data Indicates Different Risks
-
Article 1 measures reported deaths; Article 2 measures actual lightning activity.
-
The SALDN uses up-to-date scientific data, whereas Article 1 only had data until 2007.
-
Reported deaths depend on population size, not just lightning frequency.
-
Not all deaths were recorded accurately in Article 1.
Article 2 gives a more scientific and accurate risk assessment.
3. Improving Testing Accuracy
How to reduce false positives and false negatives?
- Using more advanced testing methods for higher accuracy.
- Testing multiple times to confirm results.
- Improving data analysis with better technology and statistical models.
Key Takeaways
- False positives and false negatives can affect important decisions.
- Tests are not perfect, even with high accuracy.
- Confirming results with a second test improves reliability.
- Understanding probability helps interpret test results correctly.

500K+ Students Use These Powerful Tools to Master False positives and false negatives For their NSC Exams.
Enhance your understanding with flashcards, quizzes, and exams—designed to help you grasp key concepts, reinforce learning, and master any topic with confidence!
40 flashcards
Flashcards on False positives and false negatives
Revise key concepts with interactive flashcards.
Try Mathematical Literacy Flashcards5 quizzes
Quizzes on False positives and false negatives
Test your knowledge with fun and engaging quizzes.
Try Mathematical Literacy Quizzes29 questions
Exam questions on False positives and false negatives
Boost your confidence with real exam questions.
Try Mathematical Literacy Questions27 exams created
Exam Builder on False positives and false negatives
Create custom exams across topics for better practice!
Try Mathematical Literacy exam builder64 papers
Past Papers on False positives and false negatives
Practice past papers to reinforce exam experience.
Try Mathematical Literacy Past PapersOther Revision Notes related to False positives and false negatives you should explore
Discover More Revision Notes Related to False positives and false negatives to Deepen Your Understanding and Improve Your Mastery
Load more notes