Photo AI
Figure 3 shows the banding pattern of a single sarcomere - AQA - A-Level Biology - Question 4 - 2020 - Paper 1
Question 4
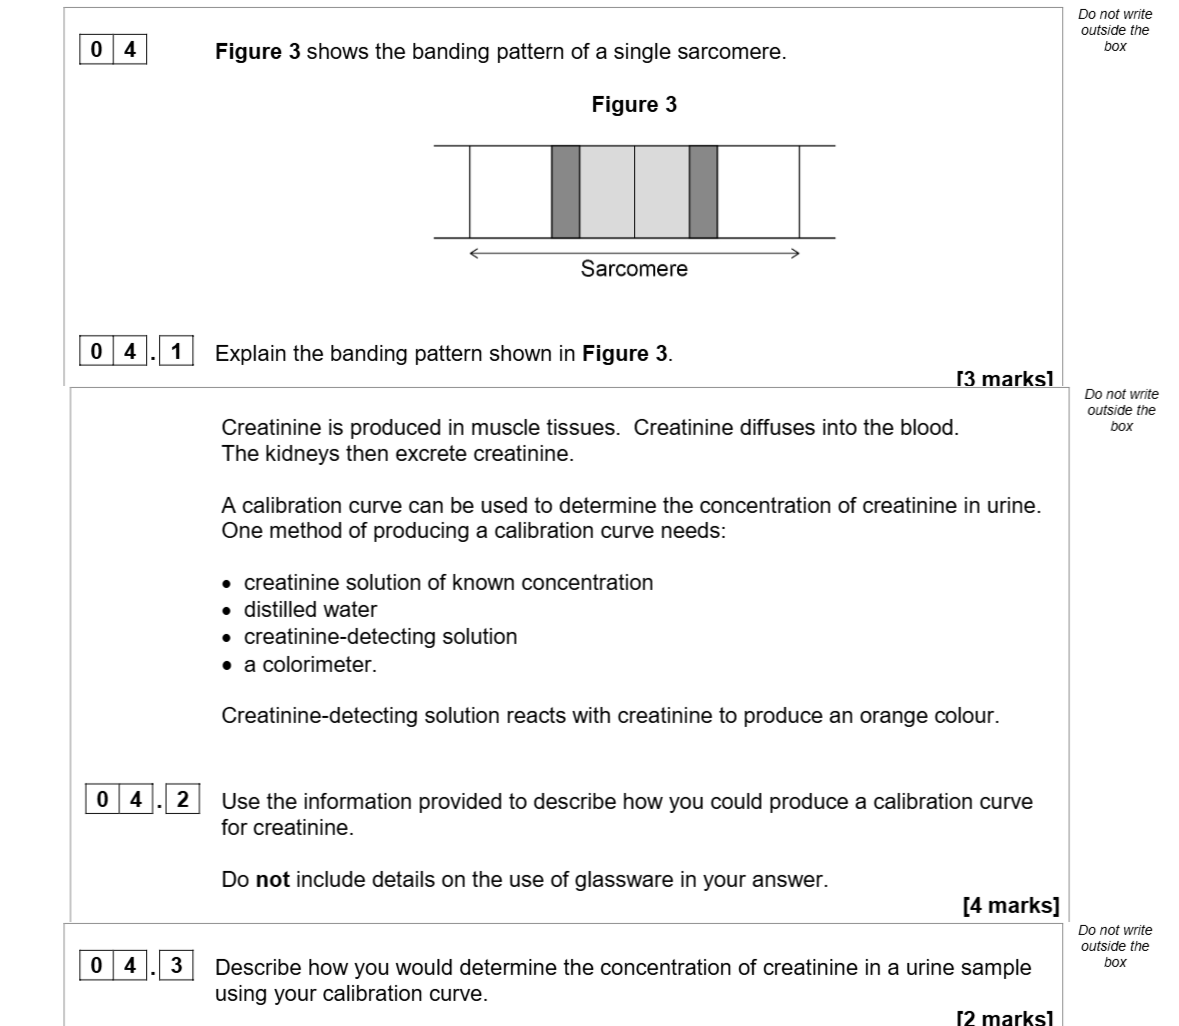
Figure 3 shows the banding pattern of a single sarcomere. 0 4.1 Explain the banding pattern shown in Figure 3. 3 marks Creatinine is produced in muscle tissues. C... show full transcript
Worked Solution & Example Answer:Figure 3 shows the banding pattern of a single sarcomere - AQA - A-Level Biology - Question 4 - 2020 - Paper 1
Step 1
Explain the banding pattern shown in Figure 3.

Answer
The banding pattern in Figure 3 represents the arrangement of thick and thin filaments within a sarcomere. The darker regions indicate areas of overlapping actin (thin filaments) and myosin (thick filaments), where contraction occurs. The H zone, which appears lighter, consists of only myosin filaments and lacks actin overlap. This structural arrangement is crucial for muscle contraction and relaxation, with the distinct it bands where actin is present, and the A band showing the overlap.
Step 2
Use the information provided to describe how you could produce a calibration curve for creatinine.
Answer
To produce a calibration curve for creatinine, follow these steps:
- Use distilled water to dilute the known concentration of creatinine solution to various concentrations.
- Prepare the creatinine-detecting solution to be mixed with each diluted creatinine solution.
- Measure the absorbance or transmission of light through each solution using a colorimeter to determine how the color intensity changes with concentration.
- Plot the dilution/concentration of creatinine on the x-axis against the measured absorbance or transmission on the y-axis to create the calibration curve.
Step 3
Describe how you would determine the concentration of creatinine in a urine sample using your calibration curve.
Answer
To determine the concentration of creatinine in a urine sample using the calibration curve, follow these steps:
- Measure the absorbance of the urine sample mixed with the creatinine-detecting solution using the colorimeter.
- Locate the corresponding absorbance value on the calibration curve to read off the concentration of creatinine. This will give the exact concentration based on the established relationship between absorbance and creatinine concentration.