Photo AI
Last Updated Sep 26, 2025
Inequalities on Graphs Simplified Revision Notes for A-Level Edexcel Maths Pure
Revision notes with simplified explanations to understand Inequalities on Graphs quickly and effectively.
206+ students studying
2.4.3 Inequalities on Graphs
Inequalities on Graphs
When dealing with inequalities on graphs, the goal is to determine the region of the graph that satisfies a given inequality. Inequalities can be linear or quadratic, and they represent areas above, below, or between curves on the coordinate plane.
1. Linear Inequalities:
A linear inequality involves a linear equation, such as:
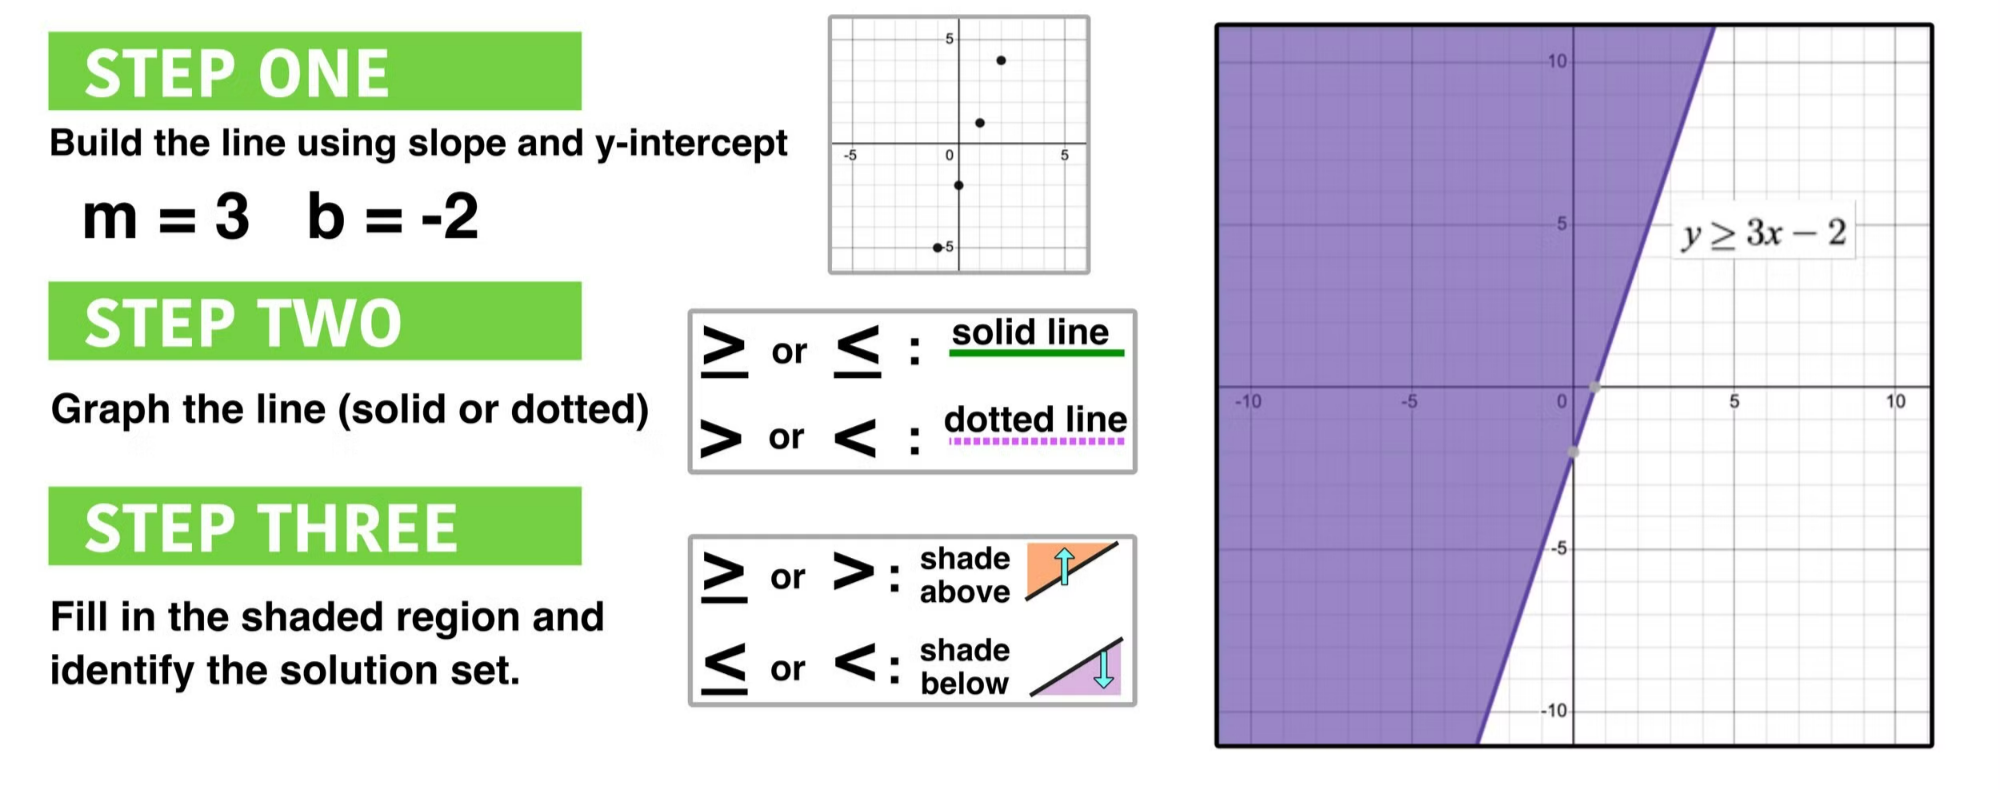
Steps to Graph:
- Graph the Boundary Line:
- Start by graphing the equation as a straight line.
- If the inequality is strict , use a dashed line to indicate that points on the line are not included.
- If the inequality is non-strict or , use a solid line to show that points on the line are included.
- Determine the Shaded Region:
- Choose a test point (often the origin, to determine which side of the line to shade.
- Substitute the test point into the inequality. If the inequality holds true, shade the region that includes the test point; otherwise, shade the opposite side.
Example: For :
- Draw the line with a dashed line.
- Test is false, so shade the region above the line.
2. Quadratic Inequalities:
Quadratic inequalities involve a quadratic equation, such as:
Steps to Graph:
- Graph the Parabola:
- Start by graphing the equation
- Use a solid line for , and a dashed line for
- Determine the Shaded Region:
- Similar to linear inequalities, choose a test point to determine which side of the parabola satisfies the inequality.
- For quadratic inequalities like the region below the parabola is typically shaded.
Example: For:
- Graph the parabola using a solid line.
- Test is false, so shade the region below the parabola.
3. Systems of Inequalities:
When working with multiple inequalities, the solution is the region where the shaded areas overlap.
Example: Solve the system:
Steps:
- Graph with a dashed line and shade above.
- Graph with a solid line and shade below.
- The solution is the region where the shaded areas overlap.
Summary:
- Linear Inequalities: Represent straight lines with shading indicating where the inequality holds true.
- Quadratic Inequalities: Involve parabolas with shading above or below the curve.
- Systems of Inequalities: Solve by finding the region where all inequalities intersect. The visual approach using graphs is crucial for understanding the solutions to inequalities, as it clearly shows the region that satisfies the given conditions.

500K+ Students Use These Powerful Tools to Master Inequalities on Graphs For their A-Level Exams.
Enhance your understanding with flashcards, quizzes, and exams—designed to help you grasp key concepts, reinforce learning, and master any topic with confidence!
40 flashcards
Flashcards on Inequalities on Graphs
Revise key concepts with interactive flashcards.
Try Maths Pure Flashcards4 quizzes
Quizzes on Inequalities on Graphs
Test your knowledge with fun and engaging quizzes.
Try Maths Pure Quizzes29 questions
Exam questions on Inequalities on Graphs
Boost your confidence with real exam questions.
Try Maths Pure Questions27 exams created
Exam Builder on Inequalities on Graphs
Create custom exams across topics for better practice!
Try Maths Pure exam builder105 papers
Past Papers on Inequalities on Graphs
Practice past papers to reinforce exam experience.
Try Maths Pure Past PapersOther Revision Notes related to Inequalities on Graphs you should explore
Discover More Revision Notes Related to Inequalities on Graphs to Deepen Your Understanding and Improve Your Mastery