Photo AI
Last Updated Sep 27, 2025
Using Log Graphs in Modelling Simplified Revision Notes for A-Level OCR Maths Pure
Revision notes with simplified explanations to understand Using Log Graphs in Modelling quickly and effectively.
242+ students studying
6.3.3 Using Log Graphs in Modelling
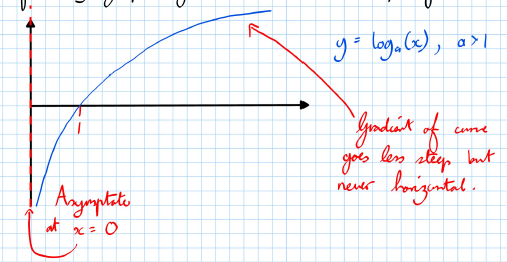
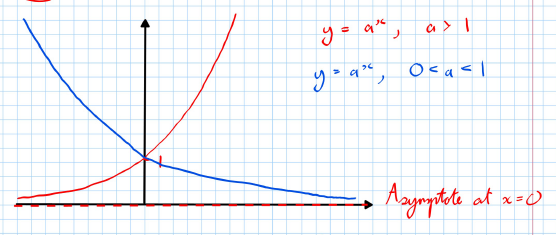
Logarithmic and Exponential Graphs
Important Graph Shapes to Learn:
- Logarithmic Graph: , where
- The curve starts steep and becomes less steep as increases, but it never becomes horizontal.
- Asymptote at .
- Exponential Graphs:
- The curve rises or falls exponentially depending on the value of .
- Asymptote at .
Example: Sketching the graph of
- Start by recognizing the base graph: .
- To sketch , perform a translation of on the base graph. The graph will shift 3 units to the left, moving the asymptote to .
Example: Sketch the graph of
- Always a good idea to have a "start graph" then apply transformations to it.
- Start with the graph of (in red).
- Apply the following transformations:
- Stretch by scale factor 2, parallel to the -axis: This gives us the graph of (in blue).
- Stretch by scale factor parallel to the -axis: This gives us the graph of (in green).
- The final graph is (shown in green on the right-hand side).
- Key feature: The asymptote of the graph is at = 0.
Q3. (OCR 4722, Jun 2008, Q8)
(i) Sketch the curve , stating the coordinates of any intersections with the axes.
Sketch:
- The curve intersects the -axis at .
- There is no intersection with the -axis as the curve approaches zero asymptotically but never actually touches the -axis. (ii) The curve intersects the curve at the point . Show that the -coordinate of may be written as:
Solution:
Given:
Set the two equations equal to find the intersection point:
Take the logarithm of both sides (base 2):
Apply the logarithm rules:
Simplify using the power rule:
Rearrange to solve for :
Thus,
This is the required -coordinate of the intersection point .

500K+ Students Use These Powerful Tools to Master Using Log Graphs in Modelling For their A-Level Exams.
Enhance your understanding with flashcards, quizzes, and exams—designed to help you grasp key concepts, reinforce learning, and master any topic with confidence!
40 flashcards
Flashcards on Using Log Graphs in Modelling
Revise key concepts with interactive flashcards.
Try Maths Pure Flashcards4 quizzes
Quizzes on Using Log Graphs in Modelling
Test your knowledge with fun and engaging quizzes.
Try Maths Pure Quizzes29 questions
Exam questions on Using Log Graphs in Modelling
Boost your confidence with real exam questions.
Try Maths Pure Questions27 exams created
Exam Builder on Using Log Graphs in Modelling
Create custom exams across topics for better practice!
Try Maths Pure exam builder12 papers
Past Papers on Using Log Graphs in Modelling
Practice past papers to reinforce exam experience.
Try Maths Pure Past PapersOther Revision Notes related to Using Log Graphs in Modelling you should explore
Discover More Revision Notes Related to Using Log Graphs in Modelling to Deepen Your Understanding and Improve Your Mastery
96%
114 rated
Modelling with Exponentials & Logarithms
Exponential Growth & Decay
376+ studying
191KViews96%
114 rated
Modelling with Exponentials & Logarithms
Using Exps & Logs in Modelling
293+ studying
196KViews