A gym has three different formulas to estimate your maximum heart rate (Max HR), given your age in years - Junior Cycle Mathematics - Question 10 - 2015
Question 10
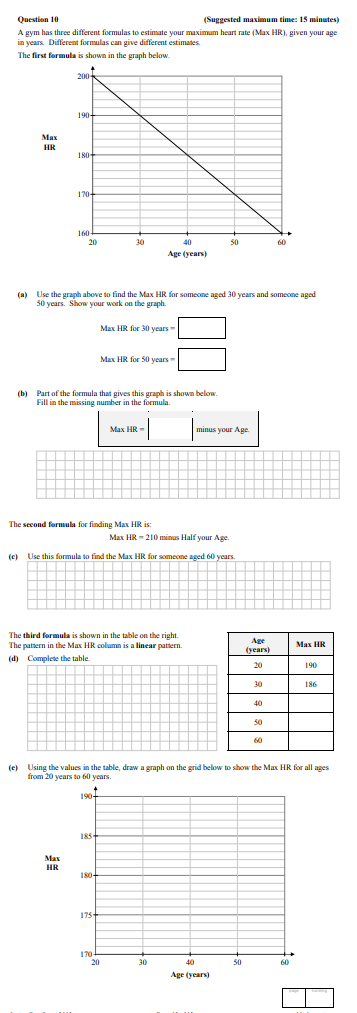
A gym has three different formulas to estimate your maximum heart rate (Max HR), given your age in years. Different formulas can give different estimates.
The first... show full transcript
Worked Solution & Example Answer:A gym has three different formulas to estimate your maximum heart rate (Max HR), given your age in years - Junior Cycle Mathematics - Question 10 - 2015
Step 1
Use the graph above to find the Max HR for someone aged 30 years and someone aged 50 years.
96%
114 rated
Only available for registered users.
Sign up now to view full answer, or log in if you already have an account!
Answer
From the graph:
Max HR for 30 years = 190
Max HR for 50 years = 170
These values can be found by drawing a vertical line at the respective ages and observing where it intersects the Max HR line.
Step 2
Fill in the missing number in the formula.
99%
104 rated
Only available for registered users.
Sign up now to view full answer, or log in if you already have an account!
Answer
The missing number in the formula is 220. Thus, the formula reads:
Max HR = 220 minus your Age.
Step 3
Use this formula to find the Max HR for someone aged 60 years.
96%
101 rated
Only available for registered users.
Sign up now to view full answer, or log in if you already have an account!
Answer
Using the formula Max HR = 210 minus Half your Age:
Max HR = 210 - (60/2) = 210 - 30 = 180.
Step 4
Complete the table.
98%
120 rated
Only available for registered users.
Sign up now to view full answer, or log in if you already have an account!
Answer
Age (years)
Max HR
20
190
30
186
40
182
50
178
60
174
Step 5
Using the values in the table, draw a graph on the grid below to show the Max HR for all ages from 20 years to 60 years.
97%
117 rated
Only available for registered users.
Sign up now to view full answer, or log in if you already have an account!
Answer
To graph the Max HR values:
Label the x-axis for Age (20 to 60 years).
Label the y-axis for Max HR (160 to 200).
Plot the points from the table:
(20, 190)
(30, 186)
(40, 182)
(50, 178)
(60, 174)
Draw a line connecting the points to show the trend in Max HR.
Join the Junior Cycle students using SimpleStudy...