Photo AI
A science student investigated the solubility of two common substances, sugar and salt, in water for a range of temperatures - Junior Cycle Science - Question a - 2013
Question a
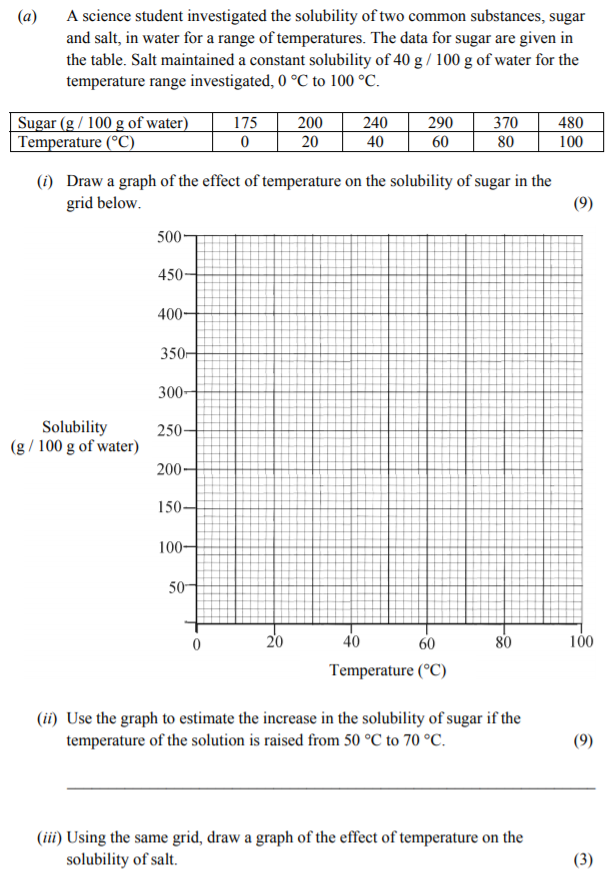
A science student investigated the solubility of two common substances, sugar and salt, in water for a range of temperatures. The data for sugar are given in the tab... show full transcript
Worked Solution & Example Answer:A science student investigated the solubility of two common substances, sugar and salt, in water for a range of temperatures - Junior Cycle Science - Question a - 2013
Step 1
Draw a graph of the effect of temperature on the solubility of sugar in the grid below.

Answer
To draw the graph accurately, follow these steps:
-
Plotting Points: Based on the table provided, plot the following points on the graph:
- (0, 175)
- (20, 200)
- (40, 240)
- (60, 290)
- (80, 370)
- (100, 480)
-
Drawing the Curve: After plotting the points, use a smooth line or curve to connect them, ensuring that the curve reflects the trend of increasing solubility with temperature.
-
Labeling Axes: Make sure the x-axis is labeled as 'Temperature (°C)' and the y-axis as 'Solubility (g / 100 g of water)'.
-
Final Review: Review the graph for accuracy and clarity, making sure all points are plotted correctly and the curve accurately represents the data.
Step 2
Use the graph to estimate the increase in the solubility of sugar if the temperature of the solution is raised from 50 °C to 70 °C.
Answer
To estimate the increase in solubility:
-
Determine Solubility at 50 °C: Locate 50 °C on the x-axis and trace up to the curve to find the solubility value. Let's say this reads approximately 250 g / 100 g of water.
-
Determine Solubility at 70 °C: Locate 70 °C on the x-axis and trace up to the curve to find the solubility value. This might read approximately 400 g / 100 g of water.
-
Calculate Increase: Subtract the solubility at 50 °C from that at 70 °C:
Thus, the increase in solubility is approximately 150 g / 100 g of water.
Step 3
Using the same grid, draw a graph of the effect of temperature on the solubility of salt.
Answer
To draw the graph for the solubility of salt:
-
Constant Value Representation: Since salt maintains a constant solubility of 40 g / 100 g of water across all temperatures from 0 °C to 100 °C, draw a horizontal straight line at the value of 40 g / 100 g on the solubility axis.
-
Labeling: Ensure this line is labeled as 'Solubility of Salt'.
-
Final Review: Confirm that both graphs for sugar and salt are plotted on the same grid for comparative analysis.