The process of photosynthesis in plants is divided into two stages, the light stage and the dark stage - Leaving Cert Biology - Question 8 - 2018
Question 8
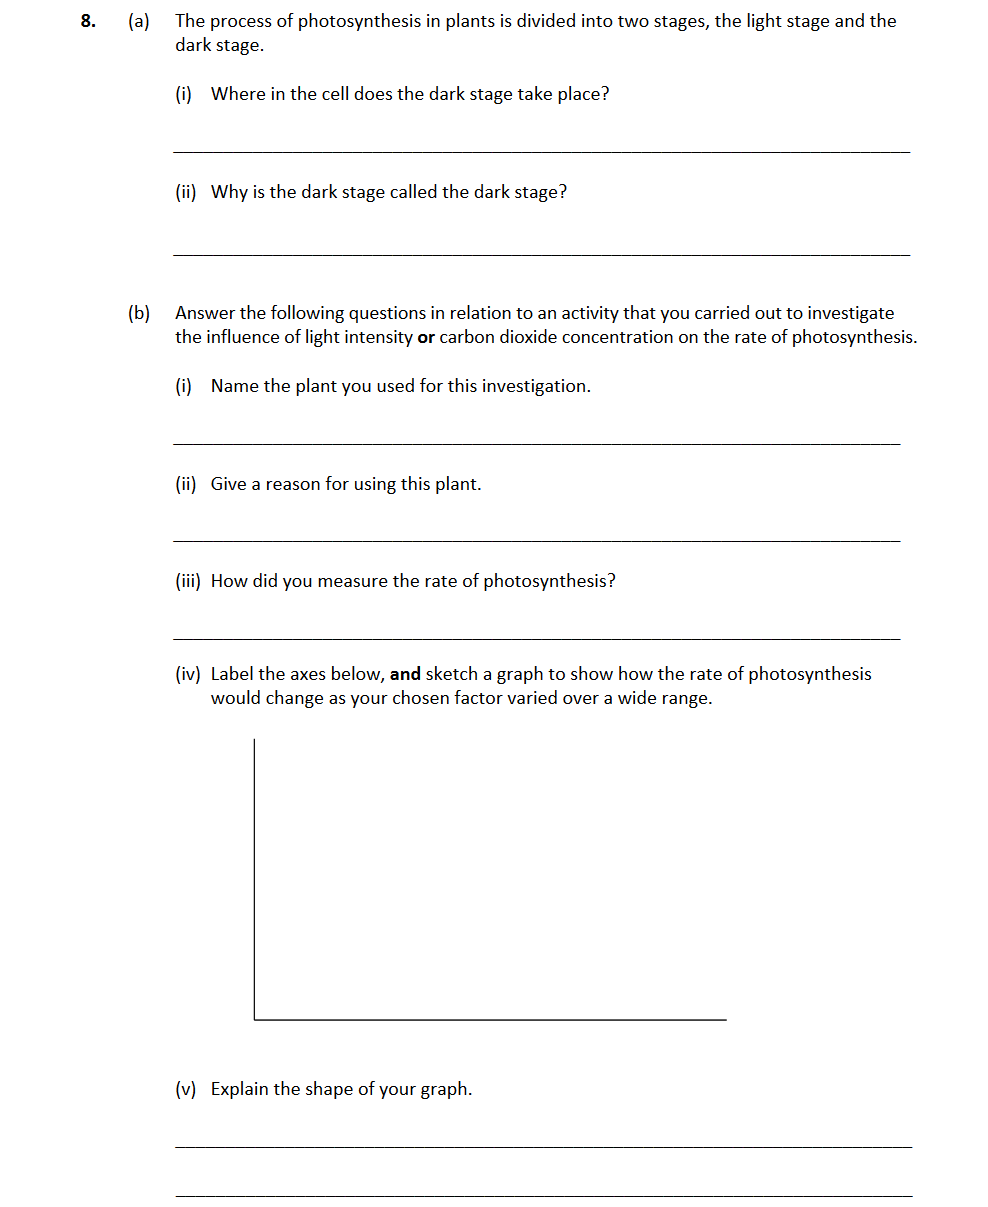
The process of photosynthesis in plants is divided into two stages, the light stage and the dark stage.
(i) Where in the cell does the dark stage take place?
__... show full transcript
Worked Solution & Example Answer:The process of photosynthesis in plants is divided into two stages, the light stage and the dark stage - Leaving Cert Biology - Question 8 - 2018
Step 1
Where in the cell does the dark stage take place?
96%
114 rated
Only available for registered users.
Sign up now to view full answer, or log in if you already have an account!
Answer
The dark stage of photosynthesis occurs in the chloroplasts of plant cells. Chloroplasts are the organelles where the light-dependent reactions take place, providing the necessary components for the light-independent reactions.
Step 2
Why is the dark stage called the dark stage?
99%
104 rated
Only available for registered users.
Sign up now to view full answer, or log in if you already have an account!
Answer
The dark stage is referred to as such because it does not require light to occur. Instead, it can happen in the absence of light, utilizing energy stored in ATP and NADPH from the light stage.
Step 3
Name the plant you used for this investigation.
96%
101 rated
Only available for registered users.
Sign up now to view full answer, or log in if you already have an account!
Answer
The plant used for this investigation is Elodea (also known as pondweed), which is a common aquatic plant used in photosynthesis experiments.
Step 4
Give a reason for using this plant.
98%
120 rated
Only available for registered users.
Sign up now to view full answer, or log in if you already have an account!
Answer
Elodea was chosen because it produces visible bubbles of oxygen when undergoing photosynthesis, making it easy to observe and measure the rate of photosynthesis.
Step 5
How did you measure the rate of photosynthesis?
97%
117 rated
Only available for registered users.
Sign up now to view full answer, or log in if you already have an account!
Answer
The rate of photosynthesis was measured by counting the number of bubbles produced by the plant in a given timeframe, or measuring the volume of gas produced per unit time.
Step 6
Label the axes below, and sketch a graph to show how the rate of photosynthesis would change as your chosen factor varied over a wide range.
97%
121 rated
Only available for registered users.
Sign up now to view full answer, or log in if you already have an account!
Answer
The x-axis should be labeled as Light Intensity (or Carbon Dioxide Concentration), and the y-axis as Rate of Photosynthesis (measured as the number of bubbles or volume of gas per unit time). The graph should show an increasing trend followed by a leveling off.
Step 7
Explain the shape of your graph.
96%
114 rated
Only available for registered users.
Sign up now to view full answer, or log in if you already have an account!
Answer
As light intensity or carbon dioxide concentration increases, the rate of photosynthesis initially rises due to more energy or reactants being available. However, at a certain point, the rate levels off as it reaches a saturation point, limited by other factors.
Join the Leaving Cert students using SimpleStudy...