This Contour Map is Part of Section C and should be used for answering the Geodesy Geometry Option (Question C-1) - Leaving Cert DCG - Question C-1 - 2018
Question C-1
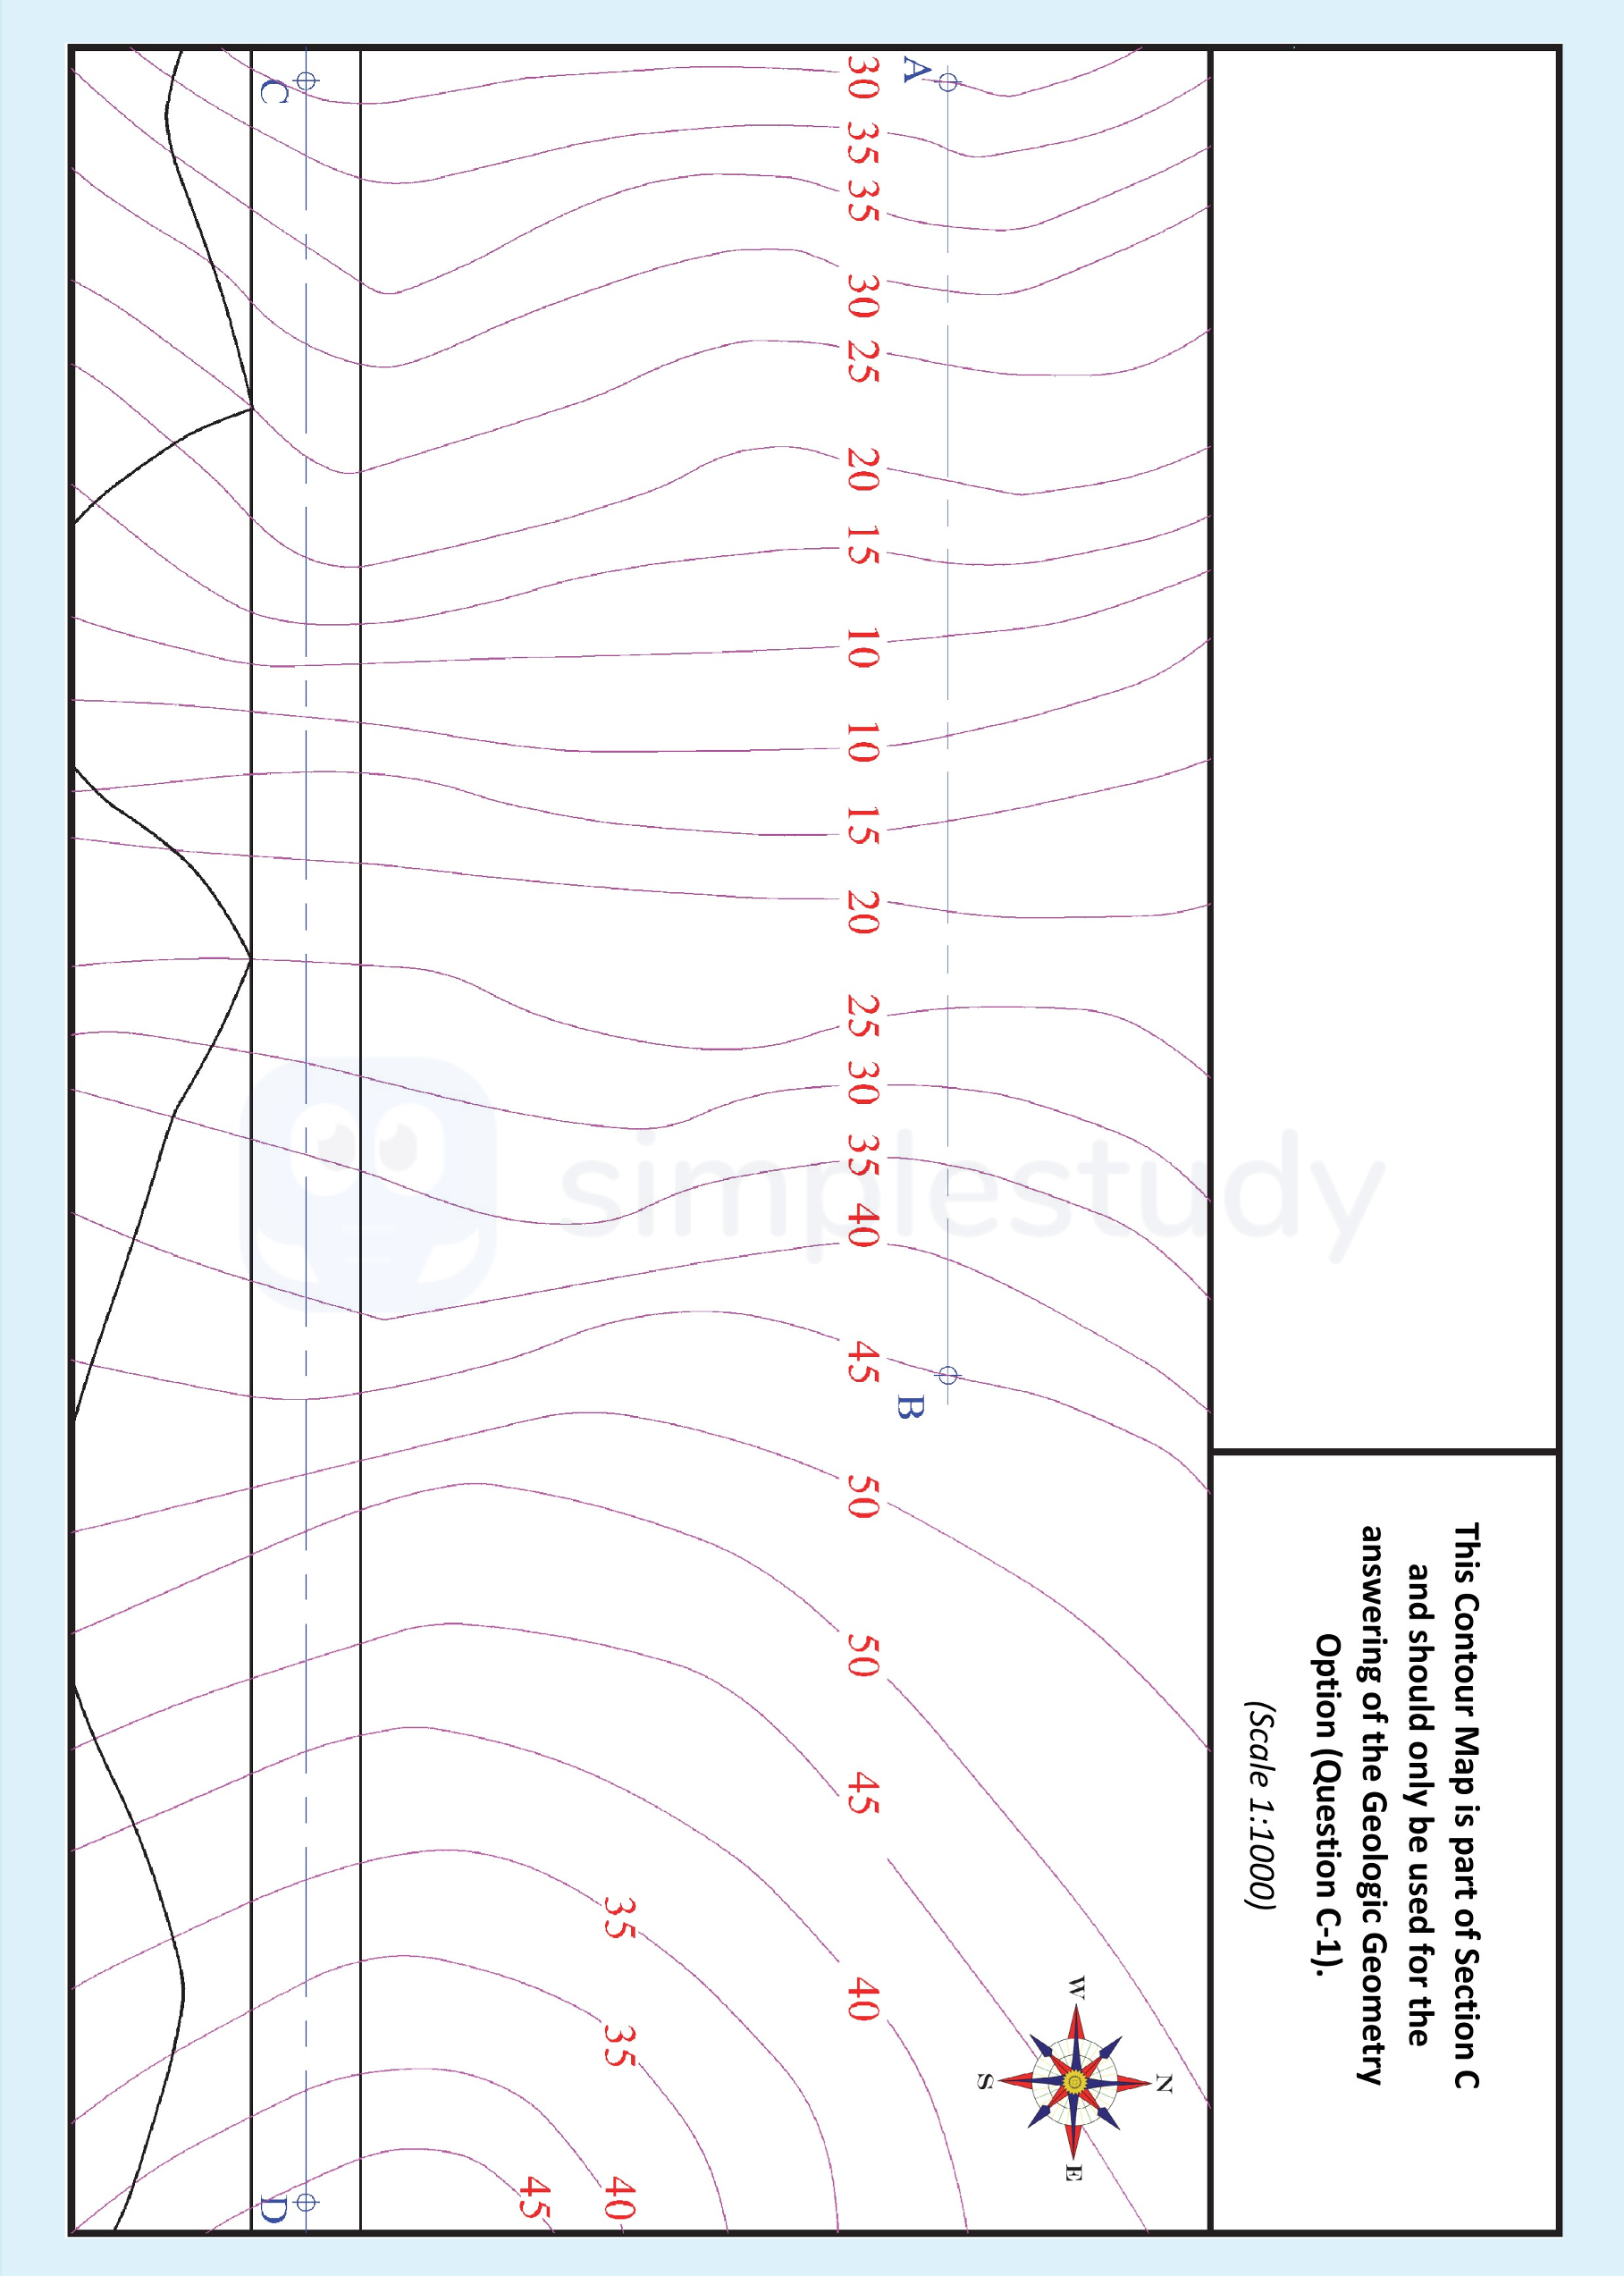
This Contour Map is Part of Section C and should be used for answering the Geodesy Geometry Option (Question C-1).
**Profile**
- Measure heights and draw horizontal... show full transcript
Worked Solution & Example Answer:This Contour Map is Part of Section C and should be used for answering the Geodesy Geometry Option (Question C-1) - Leaving Cert DCG - Question C-1 - 2018
Step 1
Measure heights and draw horizontal lines
96%
114 rated
Only available for registered users.
Sign up now to view full answer, or log in if you already have an account!
Answer
To begin, measure the heights along the contour lines at various intervals along line AB. Draw horizontal lines from these measured points to illustrate the elevations clearly on the profile. Ensure that the heights are accurately depicted, allowing for a clear visual representation of the terrain.
Step 2
Projections from intersections between line AB and contours
99%
104 rated
Only available for registered users.
Sign up now to view full answer, or log in if you already have an account!
Answer
Next, identify and mark the intersection points between line AB and the contour lines. From these points, project vertical lines downwards to the horizontal lines drawn previously. This will create a clear connection between the contour lines and the profile, aiding in the illustration of elevation changes.
Step 3
Draw outline of profile
96%
101 rated
Only available for registered users.
Sign up now to view full answer, or log in if you already have an account!
Answer
Using the intersection points derived from the previous steps, sketch the outline of the profile. Smoothly connect the points to form a coherent profile that reflects the terrain's elevations accurately based on the provided contour data.
Step 4
Draw tangent from B to profile
98%
120 rated
Only available for registered users.
Sign up now to view full answer, or log in if you already have an account!
Answer
From point B on the profile, draw a tangent line that represents the direction the roadway will take. This requires calculating the slope at point B and extending this line outwards to ensure it corresponds accurately with the profile.
Step 5
Draw pylon and indicate minimum height
97%
117 rated
Only available for registered users.
Sign up now to view full answer, or log in if you already have an account!
Answer
Next, draw the vertical pylon based on the tangent drawn from point B. Clearly indicate the minimum height of the pylon according to the project specifications. This is an essential aspect of roadway design, ensuring that any vertical structures will comply with required clearances.
Step 6
Parallel lines at 5m intervals for cuttings
97%
121 rated
Only available for registered users.
Sign up now to view full answer, or log in if you already have an account!
Answer
Mark out parallel lines at 5m intervals along the profile to denote the cutting sections. These lines should be evenly spaced and set parallel to ensure an accurate representation of excavation requirements.
Step 7
Identify points on cutting curves
96%
114 rated
Only available for registered users.
Sign up now to view full answer, or log in if you already have an account!
Answer
Once the parallel lines are drawn, identify and label key points along the cutting curves. This involves determining where the cut intersects with the lines drawn previously and marking those points clearly on the profile.
Step 8
Draw cutting curves
99%
104 rated
Only available for registered users.
Sign up now to view full answer, or log in if you already have an account!
Answer
Using the identified points from the previous step, draw smooth cutting curves to connect them. These curves should represent the natural shape of the terrain post-excavation, illustrating how the land will be modified.
Step 9
Parallel lines at 10m intervals for embankment
96%
101 rated
Only available for registered users.
Sign up now to view full answer, or log in if you already have an account!
Answer
Following the cutting curves, draw parallel lines at 10m intervals for the embankment sections. This is critical for understanding the structure of the roadway as it will ascend or descend.
Step 10
Identify points on embankment curve
98%
120 rated
Only available for registered users.
Sign up now to view full answer, or log in if you already have an account!
Answer
As with the cuttings, identify points along the embankment curve where the lines intersect. Clearly label these points as they are essential for the further detailing of the embankment's shape.
Step 11
Draw embankment curve
97%
117 rated
Only available for registered users.
Sign up now to view full answer, or log in if you already have an account!
Answer
Finally, draw the embankment curve by connecting the identified points smoothly. This curve will depict the rise of the roadway and should accurately reflect the designed slope.
Step 12
Presentation
97%
121 rated
Only available for registered users.
Sign up now to view full answer, or log in if you already have an account!
Answer
Ensure that all drawings are neat, clearly labeled, and include a legend if necessary. Present the profile, cutting, and embankment curves in a manner that is easy to read and interpret, adhering to any specific presentation guidelines provided in the marking scheme.
Join the Leaving Cert students using SimpleStudy...