Photo AI
The diagram below represents the long run equilibrium of a firm in imperfect competition - Leaving Cert Economics - Question 5 - 2019
Question 5
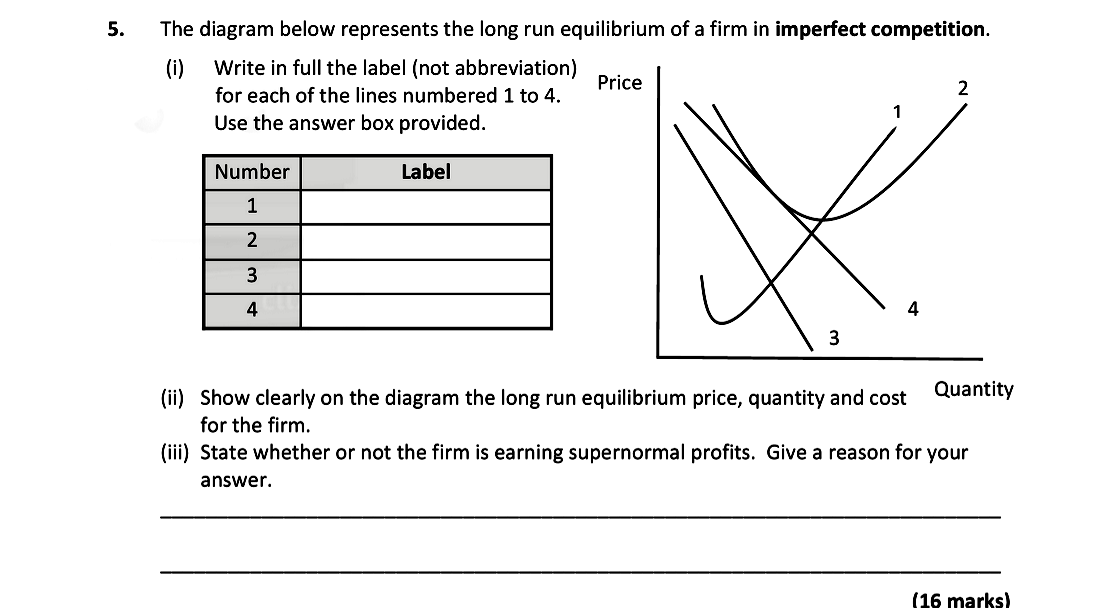
The diagram below represents the long run equilibrium of a firm in imperfect competition. (i) Write in full the label (not abbreviation) for each of the lines numbe... show full transcript
Worked Solution & Example Answer:The diagram below represents the long run equilibrium of a firm in imperfect competition - Leaving Cert Economics - Question 5 - 2019
Step 1

Step 2
Show clearly on the diagram the long run equilibrium price, quantity and cost for the firm.
Answer
In the diagram, the long run equilibrium is indicated where:
- The Marginal Cost (MC) curve intersects the Marginal Revenue (MR) curve at point Q1.
- The Average Cost (AC) curve touches the demand curve at this quantity.
- The equilibrium price is P1, and at this price, the quantity produced is Q1.
Step 3
State whether or not the firm is earning supernormal profits. Give a reason for your answer.
Answer
The firm is not earning supernormal profits; it is only earning normal profits. This is because the firm produces where Average Revenue (AR) equals Average Cost (AC), meaning that the total revenues cover exactly the total costs with no excess.