Photo AI
Study this graph which shows the annual increase in artificial land cover in Ireland 1990 – 2000 - Leaving Cert Geography - Question 1 - 2008
Question 1
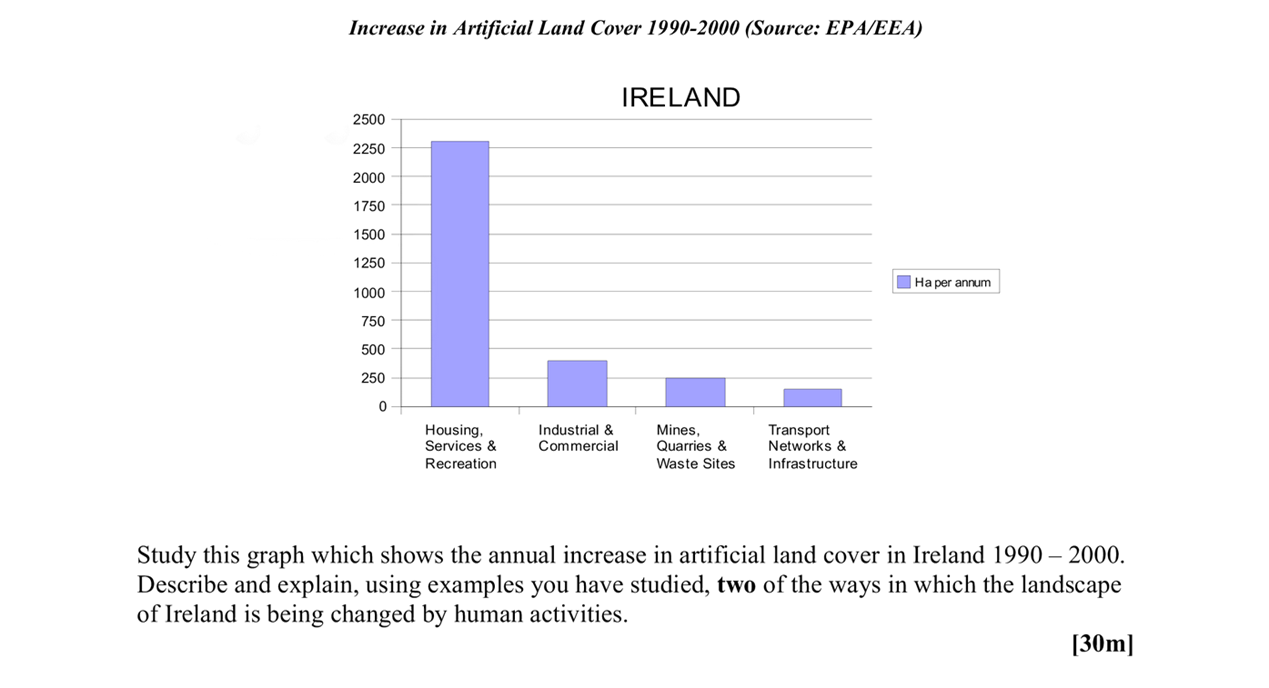
Study this graph which shows the annual increase in artificial land cover in Ireland 1990 – 2000. Describe and explain, using examples you have studied, two of the w... show full transcript
Worked Solution & Example Answer:Study this graph which shows the annual increase in artificial land cover in Ireland 1990 – 2000 - Leaving Cert Geography - Question 1 - 2008
Step 1
Two ways / changes identified:

Answer
-
Urban Development: The significant increase in housing and recreation areas reflects urban expansion. This is evident from the high figures shown in the graph, indicating a societal trend toward urbanization.
-
Infrastructure Growth: The graph shows notable increases in transport and infrastructure, indicating human activities focused on expanding transportation networks to support a growing population.
Step 2
Two named examples:
Answer
-
Housing Developments in Dublin: The spike in artificial land cover in housing shows how cities like Dublin are expanding into surrounding landscapes, resulting in the loss of natural habitats.
-
Transport Projects like the M50 Motorway: The construction of the M50 in Dublin exemplifies how transport infrastructure is being prioritized, drastically altering the landscape.
Step 3
Description / Explanation:
Answer
The increase in artificial land cover due to urban expansion and infrastructure projects has profound implications for Ireland's landscape. Firstly, urban development typically replaces agricultural land and natural spaces, impacting biodiversity and ecosystems. The expansion of housing in urban centers has led to a segmented landscape, resulting in habitat loss for various species.
Secondly, the growth of transport infrastructure is not just a physical alteration; it also influences socio-economic dynamics. Improved connectivity encourages further urbanization as remote areas become more accessible, leading to a continuous cycle of landscape change. Roads and transport routes also fragment natural areas, hindering wildlife movement and contributing to ecosystem degradation.