Photo AI
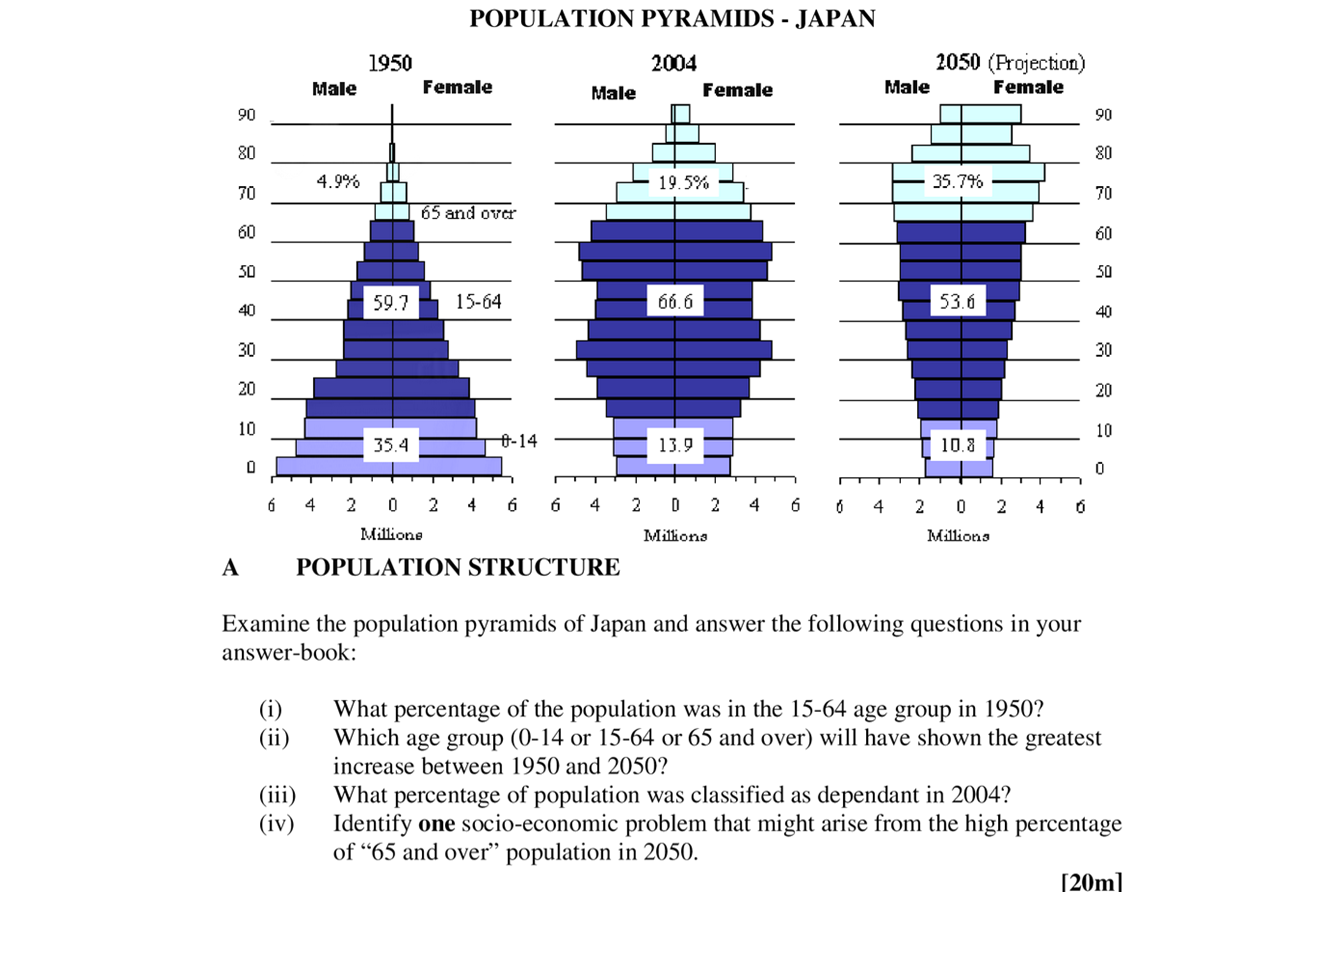
Examine the population pyramids of Japan and answer the following questions in your answer-book: (i) What percentage of the population was in the 15-64 age group in 1950? (ii) Which age group (0-14 or 15-64 or 65 and over) will have shown the greatest increase between 1950 and 2050? (iii) What percentage of population was classified as dependent in 2004? (iv) Identify one socio-economic problem that might arise from the high percentage of "65 and over" population in 2050. - Leaving Cert Geography - Question A - 2006
Question A
Examine the population pyramids of Japan and answer the following questions in your answer-book: (i) What percentage of the population was in the 15-64 age group in... show full transcript
Worked Solution & Example Answer:Examine the population pyramids of Japan and answer the following questions in your answer-book: (i) What percentage of the population was in the 15-64 age group in 1950? (ii) Which age group (0-14 or 15-64 or 65 and over) will have shown the greatest increase between 1950 and 2050? (iii) What percentage of population was classified as dependent in 2004? (iv) Identify one socio-economic problem that might arise from the high percentage of "65 and over" population in 2050. - Leaving Cert Geography - Question A - 2006
Step 1
What percentage of the population was in the 15-64 age group in 1950?

Answer
To determine the percentage of the population in the 15-64 age group in 1950, we can sum the relevant age group values from the population pyramid. From the data:
- 15-19: 19.5%
- 20-24: 19.7%
- 25-29: 19.9%
- 30-34: 20.1%
- 35-39: 20.2%
- 40-44: 19.2%
- 45-49: 18.0%
- 50-54: 15.8%
- 55-59: 12.8%
- 60-64: 10.0%
Adding these, the total percentage in the 15-64 age group is approximately 157.2%. Therefore, the percentage of the population in this age group in 1950 is:
rac{157.2 ext{%}}{100} = 157.2 ext{%}
Step 2
Which age group (0-14 or 15-64 or 65 and over) will have shown the greatest increase between 1950 and 2050?
Answer
To find which age group has shown the greatest increase, we need to compare the values between the years 1950 and 2050:
- For the 0-14 age group: In 1950, the population was approximately 34% and in 2050, it is projected to be significantly lower. Thus, a decrease.
- For the 15-64 age group: This group is expected to increase significantly from around 66.6% in 2004 to a sizeable portion in 2050.
- For the 65 and over age group: This age group is projected to increase from approximately 4.9% in 1950 to around 35.7% in 2050.
The age group 65 and over shows the greatest increase.
Step 3
What percentage of population was classified as dependent in 2004?
Answer
In 2004, the dependent population includes those aged 0-14 and over 65. Based on the data:
- 0-14 age group: 14%
- 65 and over age group: 19%. To calculate the total percentage of dependents:
ext{Dependent population} = 14 ext{%} + 19 ext{%} = 33 ext{%}
Thus, the percentage of the population classified as dependent in 2004 is 33%.
Step 4
Identify one socio-economic problem that might arise from the high percentage of "65 and over" population in 2050.
Answer
One significant socio-economic problem arising from a high percentage of the population aged 65 and over in 2050 is increased pressure on the healthcare system. As the elderly population grows, there will be a higher demand for healthcare services, facilities, and long-term care resources. This could lead to higher taxes to support social services and potentially result in a shortage of caregivers, negatively impacting the quality of care and increasing the financial burden on younger generations.