The table below refers to Carbon Dioxide emissions in Ireland from 1999 to 2003 - Leaving Cert Geography - Question Question 1 - 2007
Question Question 1
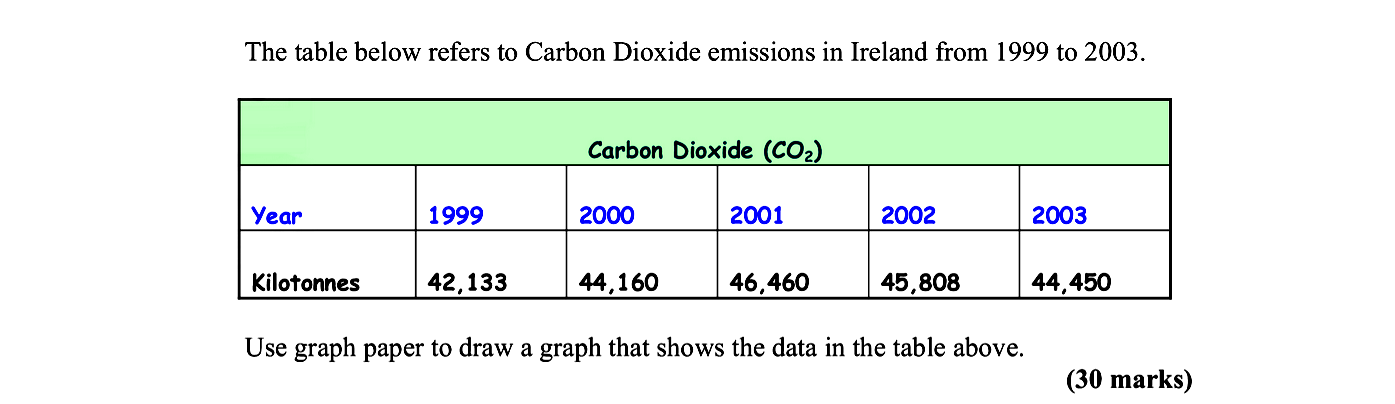
The table below refers to Carbon Dioxide emissions in Ireland from 1999 to 2003.
| Year | 1999 | 2000 | 2001 | 2002 | 2003 |
|------|------|------|------|------|---... show full transcript
Worked Solution & Example Answer:The table below refers to Carbon Dioxide emissions in Ireland from 1999 to 2003 - Leaving Cert Geography - Question Question 1 - 2007
Step 1
Vertical Axis labelled
96%
114 rated
Only available for registered users.
Sign up now to view full answer, or log in if you already have an account!
Answer
Label the vertical axis as 'Kilotonnes' with appropriate units. Ensure it is clear and readable.
Step 2
Horizontal Axis labelled
99%
104 rated
Only available for registered users.
Sign up now to view full answer, or log in if you already have an account!
Answer
Label the horizontal axis as 'Year', centering the label for clarity.
Step 3
Graph Data Representation - Year 1999
96%
101 rated
Only available for registered users.
Sign up now to view full answer, or log in if you already have an account!
Answer
Plot a point at (1999, 42133) on the graph, marking it clearly with a circle.
Step 4
Graph Data Representation - Year 2000
98%
120 rated
Only available for registered users.
Sign up now to view full answer, or log in if you already have an account!
Answer
Plot a point at (2000, 44160) on the graph, marking it clearly with a circle.
Step 5
Graph Data Representation - Year 2001
97%
117 rated
Only available for registered users.
Sign up now to view full answer, or log in if you already have an account!
Answer
Plot a point at (2001, 46460) on the graph, marking it clearly with a circle.
Step 6
Graph Data Representation - Year 2002
97%
121 rated
Only available for registered users.
Sign up now to view full answer, or log in if you already have an account!
Answer
Plot a point at (2002, 45808) on the graph, marking it clearly with a circle.
Step 7
Graph Data Representation - Year 2003
96%
114 rated
Only available for registered users.
Sign up now to view full answer, or log in if you already have an account!
Answer
Plot a point at (2003, 44450) on the graph, marking it clearly with a circle.
Step 8
Connect Points
99%
104 rated
Only available for registered users.
Sign up now to view full answer, or log in if you already have an account!
Answer
Optionally, connect the points with a line to show the trend in carbon dioxide emissions over the years.
Step 9
Final Touches
96%
101 rated
Only available for registered users.
Sign up now to view full answer, or log in if you already have an account!
Answer
Add a title to the graph, such as 'Carbon Dioxide Emissions in Ireland (1999-2003)', and ensure all points and labels are clearly visible.
Join the Leaving Cert students using SimpleStudy...