Photo AI
In an experiment to verify Boyle’s law, a student took the set of readings given in the table below - Leaving Cert Physics - Question 2 - 2013
Question 2
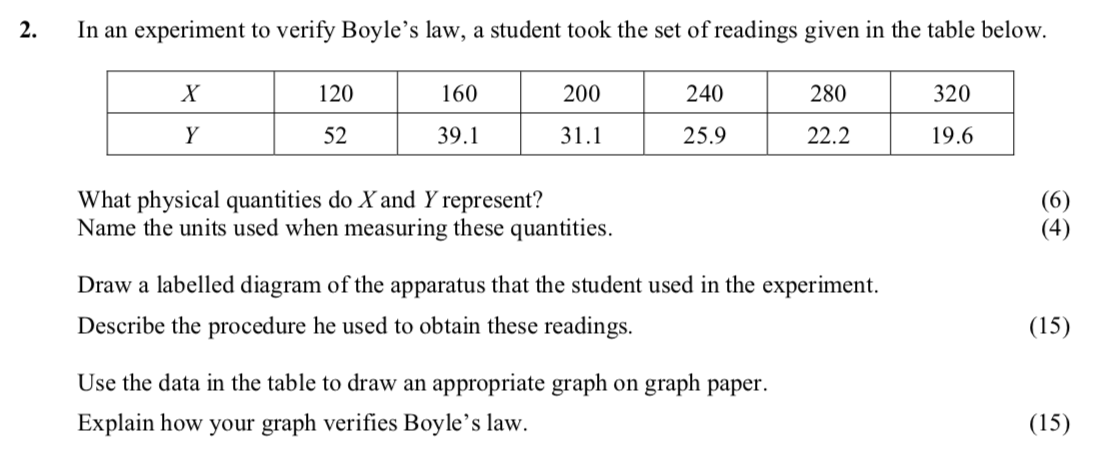
In an experiment to verify Boyle’s law, a student took the set of readings given in the table below. X | 120 | 160 | 200 | 240 | 280 | 320 ---|-----|-----|-----|-... show full transcript
Worked Solution & Example Answer:In an experiment to verify Boyle’s law, a student took the set of readings given in the table below - Leaving Cert Physics - Question 2 - 2013
Step 1

Step 2
Step 3
Draw a labelled diagram of the apparatus that the student used in the experiment.
Answer
The apparatus used for the experiment includes:
- A gas container to hold the gas.
- A pressure gauge to measure the pressure.
- A piston or adjustable apparatus for changing the volume of gas.
- The diagram should label each part clearly.
Step 4
Describe the procedure he used to obtain these readings.
Answer
- Change the volume of the gas by adjusting the piston in the container.
- Measure the pressure using the pressure gauge at different volumes.
- Record the corresponding pressure and volume values in a table.
- Repeat the measurements to ensure accuracy.
Step 5
Use the data in the table to draw an appropriate graph on graph paper.
Answer
To graph the data:
- Plot volume (X) on the x-axis and pressure (Y) on the y-axis.
- Ensure all points are plotted correctly, reflecting the volume-pressure pairs from the table.
- Draw a straight line through the plotted points indicating the relationship.
Step 6
Explain how your graph verifies Boyle’s law.
Answer
Boyle's law states that at constant temperature, the pressure of a gas is inversely proportional to its volume. The graph should display a downward slope, indicating that as the volume increases, the pressure decreases. This confirms that:
where k is a constant. The linear relationship shows that pressure is inversely proportional to volume, verifying Boyle's law.