Photo AI
The graph shows the variation in temperature θ of 150 g of crushed ice when it was supplied with energy ΔE at a constant rate - Leaving Cert Physics - Question c - 2012
Question c
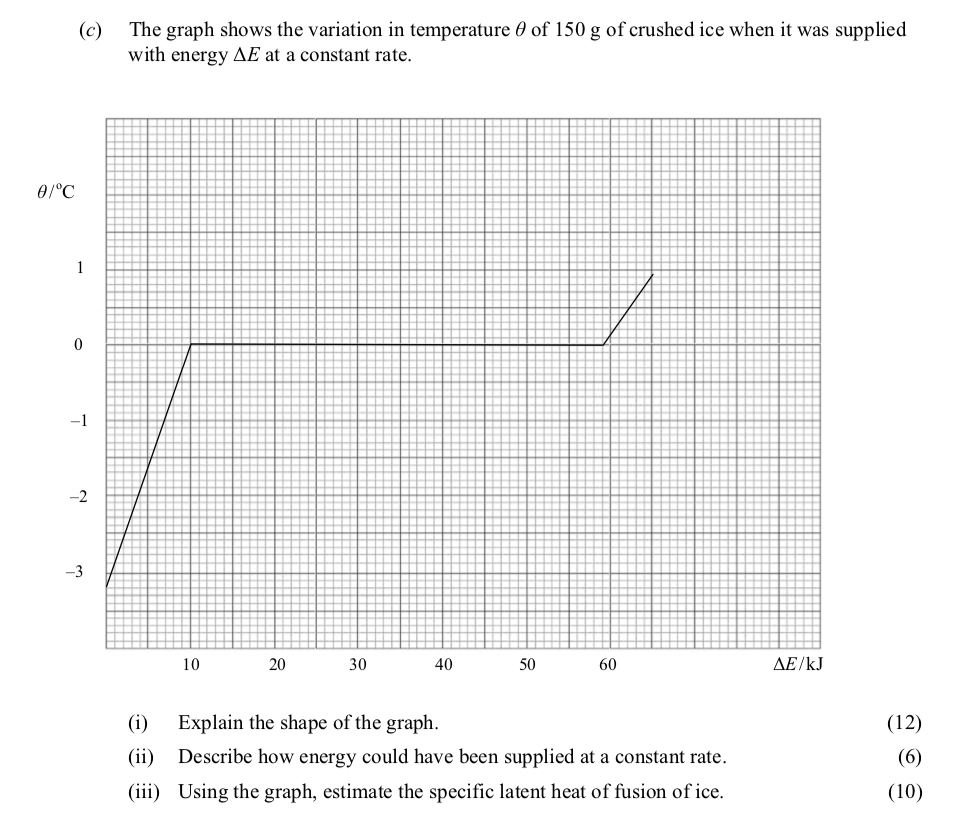
The graph shows the variation in temperature θ of 150 g of crushed ice when it was supplied with energy ΔE at a constant rate. (i) Explain the shape of the graph. ... show full transcript
Worked Solution & Example Answer:The graph shows the variation in temperature θ of 150 g of crushed ice when it was supplied with energy ΔE at a constant rate - Leaving Cert Physics - Question c - 2012
Step 1
Explain the shape of the graph

Answer
The shape of the graph can be explained in three distinct phases:
-
Temperature Increase of Ice: Initially, as energy is supplied, the temperature of the ice increases from -3 °C to 0 °C. This reflects the absorption of heat, causing the ice to warm up.
-
Constant Temperature Phase: From 0 °C, the temperature remains constant as the ice undergoes a phase change (melting). During this stage, all the supplied energy is utilized as latent heat, allowing the ice to transition into water without a change in temperature.
-
Temperature Increase of Water: Once the ice has completely melted, the temperature begins to rise again. This reflects the heating of water, which continues to increase until it reaches the next state, as indicated by the subsequent rise in the graph.
Step 2
Describe how energy could have been supplied at a constant rate
Answer
Energy can be supplied at a constant rate using the following methods:
-
Heating Element: A heating element like a resistor can be connected to the ice, allowing a controlled flow of electrical energy.
-
Joule Meter/Ammeter: A joulemeter or an ammeter could be used to monitor and measure the energy supplied. Adjustments can be made to maintain a constant supply.
-
Hotplate: Alternately, a water bath can be employed, which provides uniform heating while ensuring that the energy transfer is steady.
Step 3
Using the graph, estimate the specific latent heat of fusion of ice
Answer
To estimate the specific latent heat of fusion of ice, we can use the formula:
where:
- is the energy required to melt the ice,
- is the mass of the ice, and
- is the specific latent heat of fusion of ice.
From the graph, the energy required to melt 0.15 kg of ice (from the dataset) can be estimated as 49 kJ (as implied from the ΔE axis).
Now substituting:
Thus, the estimated specific latent heat of fusion of ice is approximately 326700 J/kg.