Photo AI
The following is part of a student’s report of an experiment to investigate the variation of current I with potential difference V for a semiconductor diode - Leaving Cert Physics - Question 4 - 2007
Question 4
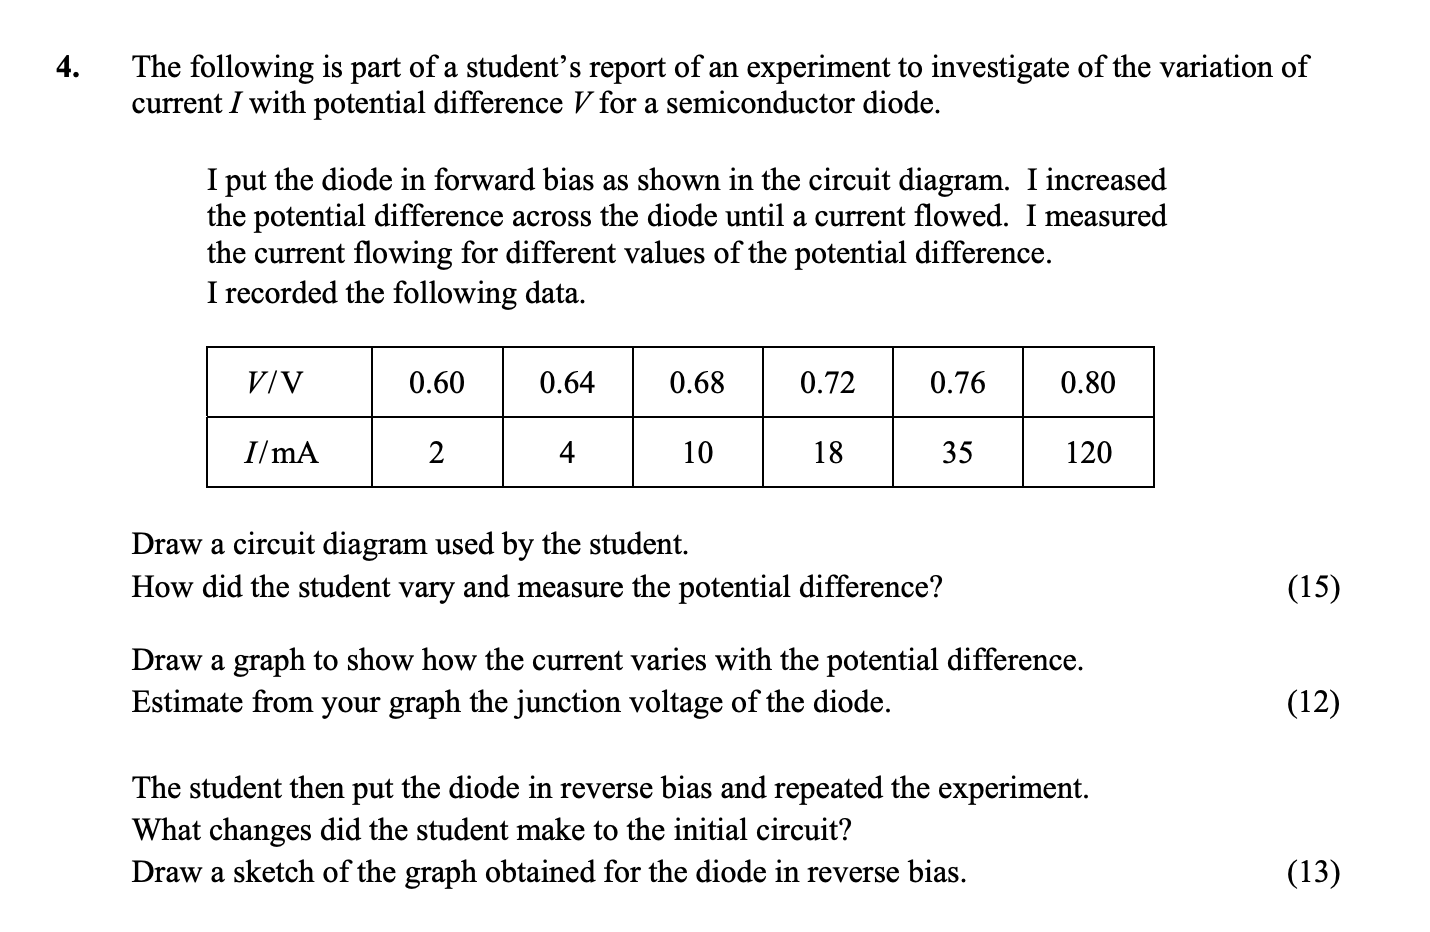
The following is part of a student’s report of an experiment to investigate the variation of current I with potential difference V for a semiconductor diode. I put ... show full transcript
Worked Solution & Example Answer:The following is part of a student’s report of an experiment to investigate the variation of current I with potential difference V for a semiconductor diode - Leaving Cert Physics - Question 4 - 2007
Step 1
Draw a circuit diagram used by the student.

Answer
The circuit diagram should include:
- A power supply (p.s.u.) connected to a diode in forward bias.
- A resistor (protective R) in series to limit current.
- An ammeter to measure the current (I) and a voltmeter connected across the diode to measure the potential difference (V). Ensure that the components are properly labeled in the diagram.
Step 2
How did the student vary and measure the potential difference?
Answer
The student varied the potential difference using a variable power supply unit (adjustable power source). The potential difference across the diode was measured using a voltmeter placed across the diode. The current was measured using an ammeter connected in series.
Step 3
Draw a graph to show how the current varies with the potential difference.
Answer
The graph should plot current (I) on the y-axis and potential difference (V) on the x-axis. Include at least 5 points corresponding to the data provided, ensuring the axes are labeled. The curve should show a rising trend as the current increases with potential difference, indicating the diode's forward characteristics.
Step 4
Step 5
What changes did the student make to the initial circuit?
Answer
In reverse bias, the student would have:
- Reversed the power supply connections.
- Replaced the ammeter to measure current flowing in reverse.
- Maintained the series combination with the diode. The configuration remains similar, but the voltage applied is now negative.
Step 6
Draw a sketch of the graph obtained for the diode in reverse bias.
Answer
The graph for reverse bias should indicate that no current flows at low voltages, often shown as '0' current, until breakdown voltage is reached where the current increases sharply (if applicable). Make sure to label the axes correctly, with 'Voltage (V)' on the x-axis and 'Current (I)' on the y-axis.