Photo AI
Last Updated Sep 27, 2025
Line Plots Simplified Revision Notes for Leaving Cert Mathematics
Revision notes with simplified explanations to understand Line Plots quickly and effectively.
447+ students studying
Line Plots
Overview
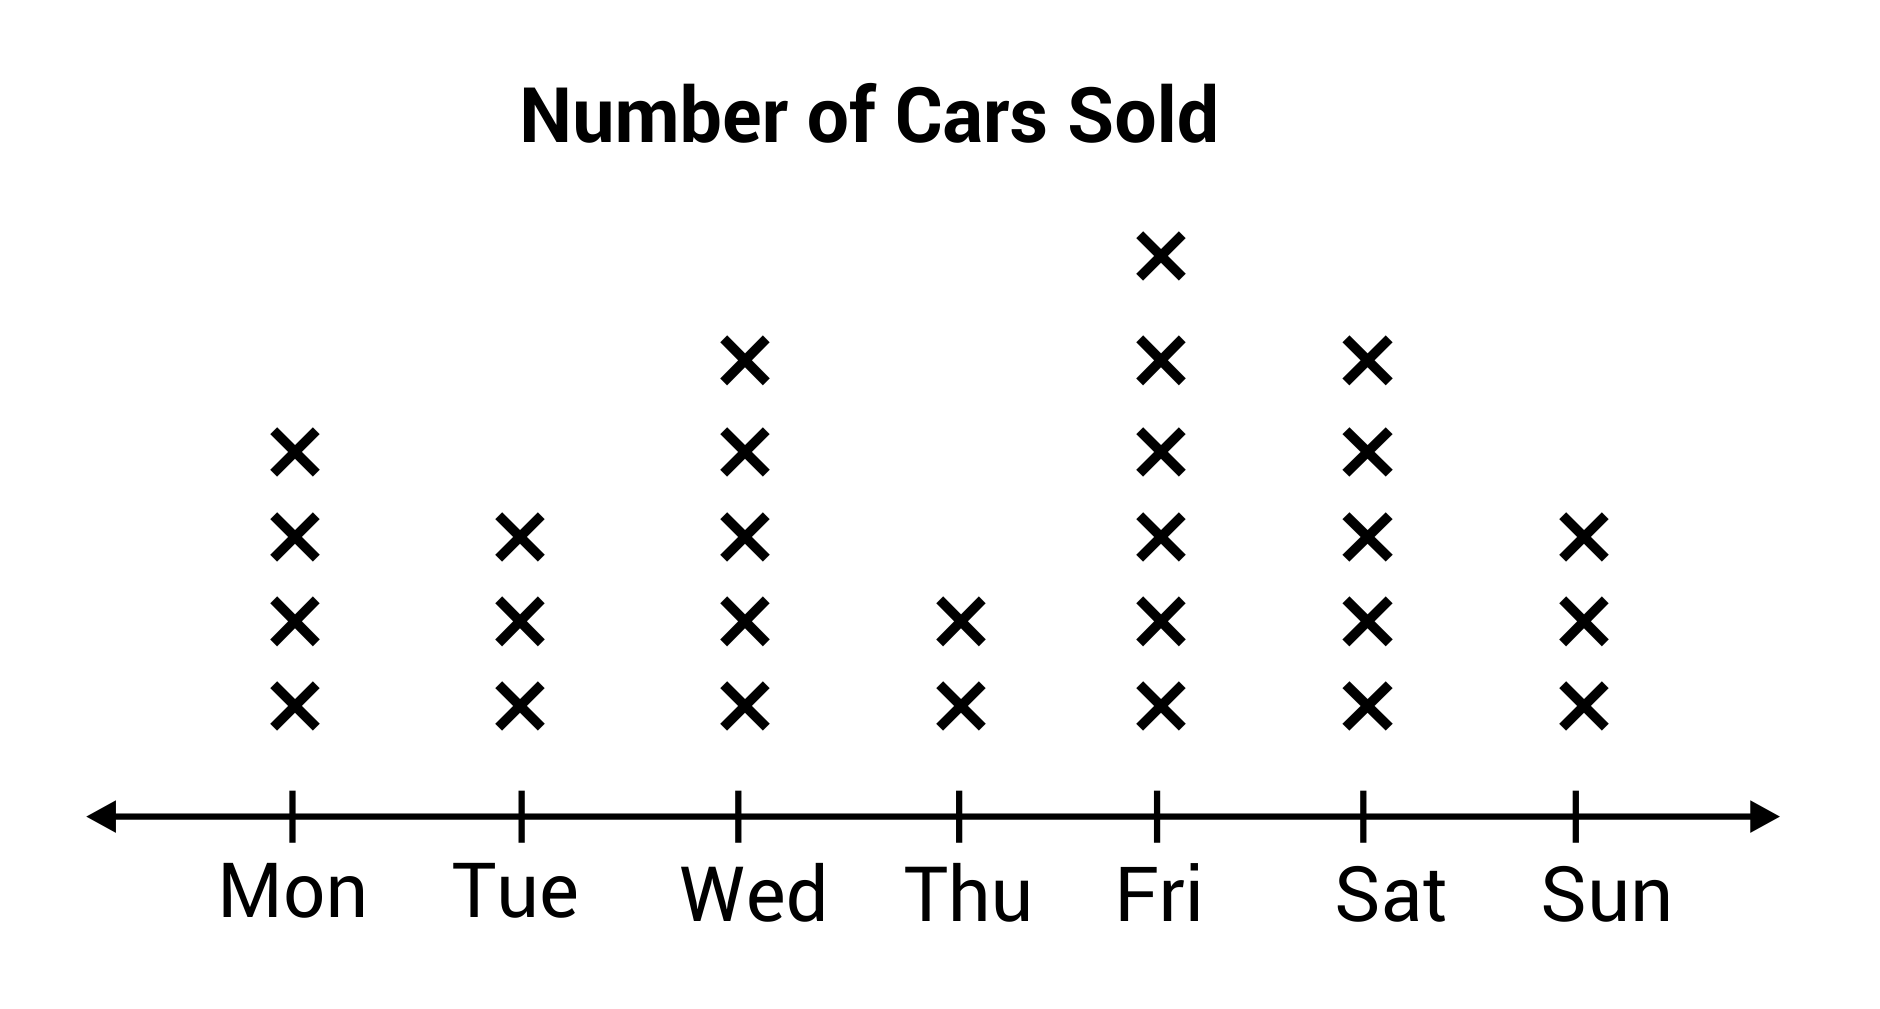
A line plot is a simple way to organise and visualise data along a number line. It is especially useful for small data sets and provides an immediate visual representation of the frequency of values.
Key Features of a Line Plot
Number Line:
- A horizontal line representing the data values.
Data Points:
- Each data value is represented by a mark (e.g., a cross or dot) above the corresponding value on the number line.
Frequency:
- The number of marks above a value indicates its frequency in the data set.
When to Use Line Plots
- To display and analyse small data sets.
- To observe the frequency distribution of data points.
- To identify patterns, gaps, or outliers in the data.
Worked Examples
Example 1: Test Scores
Problem:
A class of 10 students scored the following marks on a test: 4, 5, 5, 6, 6, 6, 7, 7, 8, 9.
Represent this data using a line plot.
Solution:
Step 1: Draw a number line:
Mark values from 4 to 9 (the range of the data set).
Step 2: Plot the data points:
Place a mark above each value for its frequency.
- One mark above 4.
- Two marks above 5.
- Three marks above 6.
- Two marks above 7.
- One mark each above 8 and 9.
Example 2: Daily Temperatures
Problem:
The daily high temperatures (in °C) for one week are: 18, 20, 20, 22, 22, 22, 24.
Create a line plot for this data.
Solution:
Step 1: Draw a number line:
Label values from 18 to 24.
Step 2: Plot the data points:
Place marks for each frequency:
- One mark above 18.
- Two marks above 20.
- Three marks above 22.
- One mark above 24.
Summary
- Line plots are effective for representing small data sets along a number line.
- Each mark on a line plot corresponds to the frequency of a data point.
- Steps to create a line plot:
- Draw a number line with the range of data values.
- Place marks above the number line for each data point.
- Analyse the plot for patterns, clusters, or outliers.
- Line plots are particularly useful for observing distributions and frequencies at a glance.

500K+ Students Use These Powerful Tools to Master Line Plots For their Leaving Cert Exams.
Enhance your understanding with flashcards, quizzes, and exams—designed to help you grasp key concepts, reinforce learning, and master any topic with confidence!
285 flashcards
Flashcards on Line Plots
Revise key concepts with interactive flashcards.
Try Mathematics Flashcards28 quizzes
Quizzes on Line Plots
Test your knowledge with fun and engaging quizzes.
Try Mathematics Quizzes29 questions
Exam questions on Line Plots
Boost your confidence with real exam questions.
Try Mathematics Questions27 exams created
Exam Builder on Line Plots
Create custom exams across topics for better practice!
Try Mathematics exam builder322 papers
Past Papers on Line Plots
Practice past papers to reinforce exam experience.
Try Mathematics Past PapersOther Revision Notes related to Line Plots you should explore
Discover More Revision Notes Related to Line Plots to Deepen Your Understanding and Improve Your Mastery