Photo AI
Last Updated Sep 27, 2025
Correlation Coefficient Simplified Revision Notes for Leaving Cert Mathematics
Revision notes with simplified explanations to understand Correlation Coefficient quickly and effectively.
440+ students studying
Correlation Coefficient
Correlation Coefficient ()
Linear correlation is a measure of how close a set of points lie to a straight line. Correlation is measured using a value called the Product Moment Correlation Coefficient, or , for short.
How to Calculate the Value on Different Calculators
Casio ClassWiz (fx-991EX / fx-570EX / 83/85/991 CW series)
Goal: Enter paired data (xi,yi)(x_i,y_i)(xi,yi) and read off r from the regression results.
-
Enter STAT mode Press [MENU] (or [MODE]) → choose STAT.
-
Choose linear regression Select A+Bx (that's the straight-line model).
-
Type your data You'll see two columns (usually List1 and List2).
- Type an x value, press = to place it.
- Move right, type the matching y value, press =.
- Move down and continue until all pairs are entered.
- Get the regression/correlation Press [OPTN] → choose Reg (Regression) → choose r.
The display shows the correlation coefficient.
Tip: To clear a whole list: while in the table, press [OPTN] → Data → Delete All (wording can vary slightly by model).
Casio fx-83/85GTX and fx-991ES PLUS (ES family)
-
STAT mode Press [MODE] → choose STAT.
-
Pick A+Bx Select the A+Bx regression type.
-
Enter pairs
- Type x, press =.
- Move right, type y, press =.
- Repeat for each pair.
- Show r Press [SHIFT] [1] (STAT) → choose Reg → choose r → =.
The calculator prints the value of r.
Notes:
- If you hit AC you do not lose data; it just exits the table. Use SHIFT 1 → Reg → r from the main screen any time after entry.
- If "Reg" is missing, you're not in a regression (A+Bx) setup—return to STAT and re-select A+Bx.
Texas Instruments TI-84 Plus CE / TI-84 Plus / TI-83
- Enter data in lists Press [STAT] → 1…
Put xxx-values in L1, yyy-values in L2 (use the arrow keys to move).
- (One-time only) Make sure 'r' will display If your regression output doesn't show r/r², turn diagnostics on:
[2nd] [0] (CATALOG) → press D to jump to D-items → choose DiagnosticOn → ENTER, ENTER. (This setting is remembered.)
- Run the linear regression [STAT] → CALC → 8(a+bx)
If needed, specify lists: type L1 , L2 (use [2nd][1] for L1, [2nd][2] for L2).
Press ENTER. You'll see a, b, r², and r.
Optional (nice for graphs): Before pressing ENTER, you can store the regression into Y1:
Type , then [VARS] → Y-VARS → 1
→ 1 so the line plots automatically.Common fixes: If you get DOMAIN ERROR, some lists are different lengths or contain blanks—clean them in STAT → Edit.
Casio fx-CG50 / fx-CG20 (graphing)
-
Open STAT [MENU] → STAT → [1] Edit.
-
Enter data Put x in List1, y in List2.
-
Compute regression Press [F2] CALC → [F1] SET and choose Linear Reg (A+Bx) if asked.
Then [F1] CALC (or [F3] depending on OS) to show results.
- Read r The results screen lists a, b, r (and often r²). Use arrows to scroll if needed.
Sharp (e.g., EL-W531/531XH/506 family)
(Menu labels differ slightly by model, but this sequence fits most modern Sharp scientifics.)
-
STAT mode Press [MODE] until you see STAT, or select STAT from the menu.
-
Select 2-variable linear regression Choose LinReg a+bx (wording may be "a+bx" or "LR").
-
Enter paired data Many Sharps accept an x, then , (comma), then y, then = to store the pair.
Repeat for all pairs. (On models with a data table, enter xxx and yyy in side-by-side columns like Casio.)
- Show r Open the STAT calculation menu (often 2ndF → STAT or a dedicated STAT key), choose Reg results, then select r to display it.
If the exact key names differ: look for STAT, a+bx, and a results page listing a, b, and r—that's the right place.
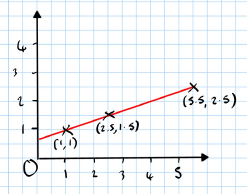
In this case, . This means perfect linear positive correlation between and .
Types of Correlation
There are different types of correlation that can be observed on the graph or through calculating the value.
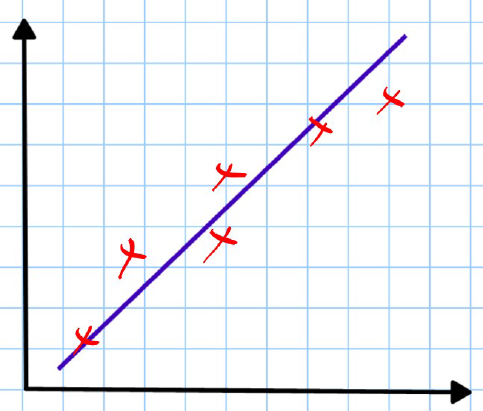
Strong Positive Correlation
- The points lie close to a straight line with a positive slope.
- will be close to .
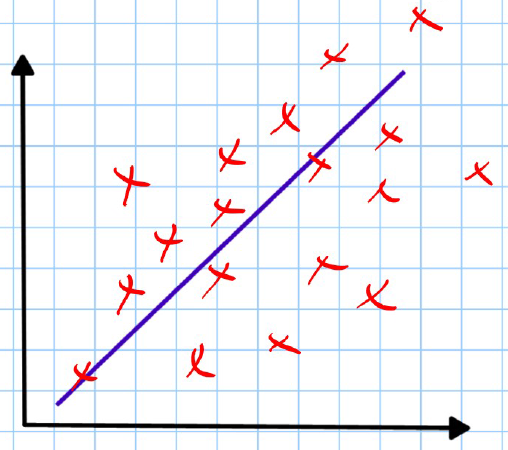
Weak Positive Correlation
- The points show some positive correlation but are more spread out.
- .
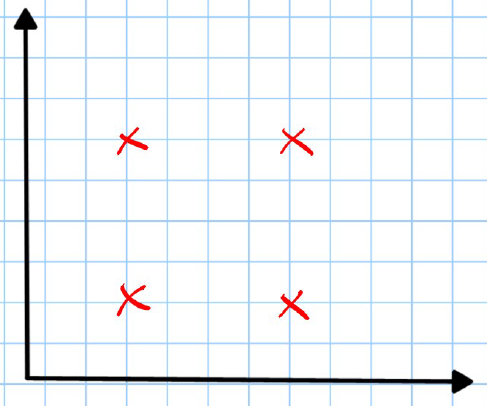
No Correlation
- The points do not show any trend or pattern.
- .
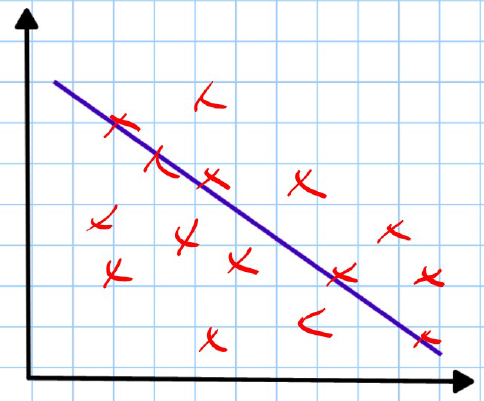
Weak Negative Correlation
- The points show some negative correlation but are more spread out.
- .
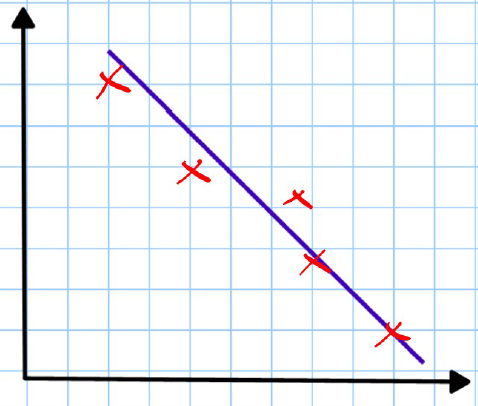
Strong Negative Correlation
- The points lie close to a straight line with a negative slope.
- is close to .
Perfect Negative Correlation
Example: Sea deaths vs Ice creams Perfect negative correlation so .
When describing correlation between two variables, it must be done in context (if possible).
If asked to describe the correlation between the variables in the above graph, we would write:
- "There is perfect negative correlation between the number of ice creams sold and sea deaths. As more ice creams are sold, the number of sea deaths decreases." Be careful not to state that one causes the other as:
"Correlation does not imply CAUSATION."

500K+ Students Use These Powerful Tools to Master Correlation Coefficient For their Leaving Cert Exams.
Enhance your understanding with flashcards, quizzes, and exams—designed to help you grasp key concepts, reinforce learning, and master any topic with confidence!
190 flashcards
Flashcards on Correlation Coefficient
Revise key concepts with interactive flashcards.
Try Mathematics Flashcards19 quizzes
Quizzes on Correlation Coefficient
Test your knowledge with fun and engaging quizzes.
Try Mathematics Quizzes29 questions
Exam questions on Correlation Coefficient
Boost your confidence with real exam questions.
Try Mathematics Questions27 exams created
Exam Builder on Correlation Coefficient
Create custom exams across topics for better practice!
Try Mathematics exam builder322 papers
Past Papers on Correlation Coefficient
Practice past papers to reinforce exam experience.
Try Mathematics Past PapersOther Revision Notes related to Correlation Coefficient you should explore
Discover More Revision Notes Related to Correlation Coefficient to Deepen Your Understanding and Improve Your Mastery
96%
114 rated
Scatter Plots & Correlation
Estimation of Correlation Coefficient
268+ studying
198KViews96%
114 rated
Scatter Plots & Correlation
Calculation of Correlation Coefficient
337+ studying
182KViews