Prediction, Games, and Outcomes (Grade 10 NSC Matric Mathematical Literacy): Revision Notes
Prediction, Games, and Outcomes
Introduction to games of chance
Games of chance, such as flipping coins and rolling dice, help us understand probability better. These games work with random events, making them useful tools for learning how to use probabilities to predict future outcomes.
Probability games are based on two important principles that make them perfect for learning about chance and prediction.
Key definitions and terminology
Understanding the language of probability is essential for working with games of chance. Here are the fundamental terms you need to know:
Frequency is the number of times that something happens.
Random refers to when something happens without being made to happen on purpose. In probability experiments, events are random, meaning they cannot be deliberately influenced in any way (provided the game is fair). You cannot make a fair dice fall on one number rather than another.
Trial is a test or single experiment. Throwing a dice or tossing a coin are examples of a trial.
Fair means treated equally, without having an advantage or disadvantage. In fair games, all outcomes have equal chances of occurring.
Theoretical probability is the calculated probability based on mathematical reasoning, not the actual experimental result.
Random events and equal chances
Two important points make games of chance useful for learning about probability:
First, the events in probability experiments are random. This means they cannot be deliberately influenced in any way (provided that the game is fair). There is no way of making a fair dice fall on one number rather than another.
Second, each possible outcome has an equal chance of occurring. All numbers on a dice have exactly the same chance of coming up when the dice is tossed - a 1 in 6 chance.
Because of these two facts, we know that when we toss a coin, we have a 50% or 0.5 or chance of getting heads, and a 50% or 0.5 or chance of getting tails.
Similarly, on a dice, there is a chance of throwing a 1; 2; 3; 4; 5 or 6.
This chance is called the theoretical probability.
When you conduct a probability experiment, such as tossing a coin a number of times, you find the relative frequency of each outcome. For example, if you toss a coin 10 times and get heads 3 times, then the relative frequency is simply 3 in 10 or .
Events vs outcomes
An outcome is the result of a single trial. For example, if you roll a dice, one outcome would be a 6.
An event is a collection of one or more outcomes. Using the example of rolling a dice, an event might be rolling an even number. This event consists of any of the outcomes 2, 4, or 6.
Single outcomes and tree diagrams
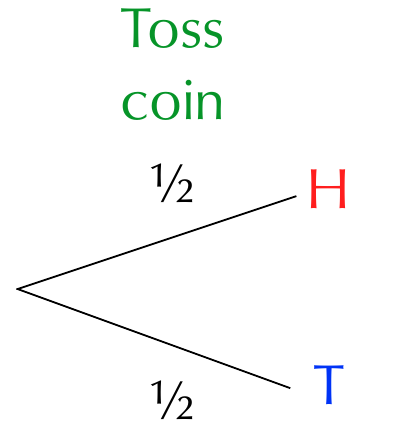
Tree diagrams help us visualise all possible outcomes and their probabilities. When we flip a coin, there are two possible outcomes, and we can represent this with a simple tree diagram.
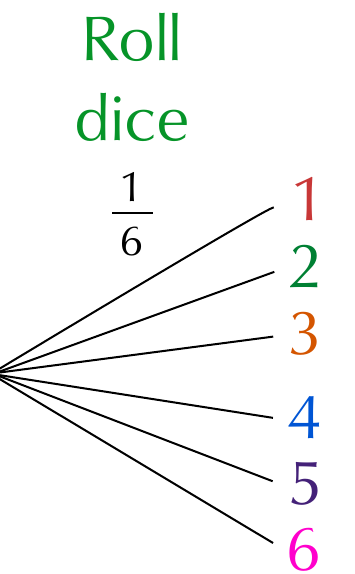
If we are rolling a dice, the tree diagram shows all six equally likely outcomes, each with a probability of .
Tree diagrams are particularly useful because they clearly show:
- All possible outcomes
- The probability of each outcome
- How outcomes branch from the starting point
Combined outcomes
Tree diagrams for combined outcomes
When we use more than one object or repeat an experiment, we call this a compound event. For example, we could get heads on the coin and a 2 on the dice, and we could write this result as H2.
Let's look at how a tree diagram shows combined outcomes when we toss a coin and then throw a dice.
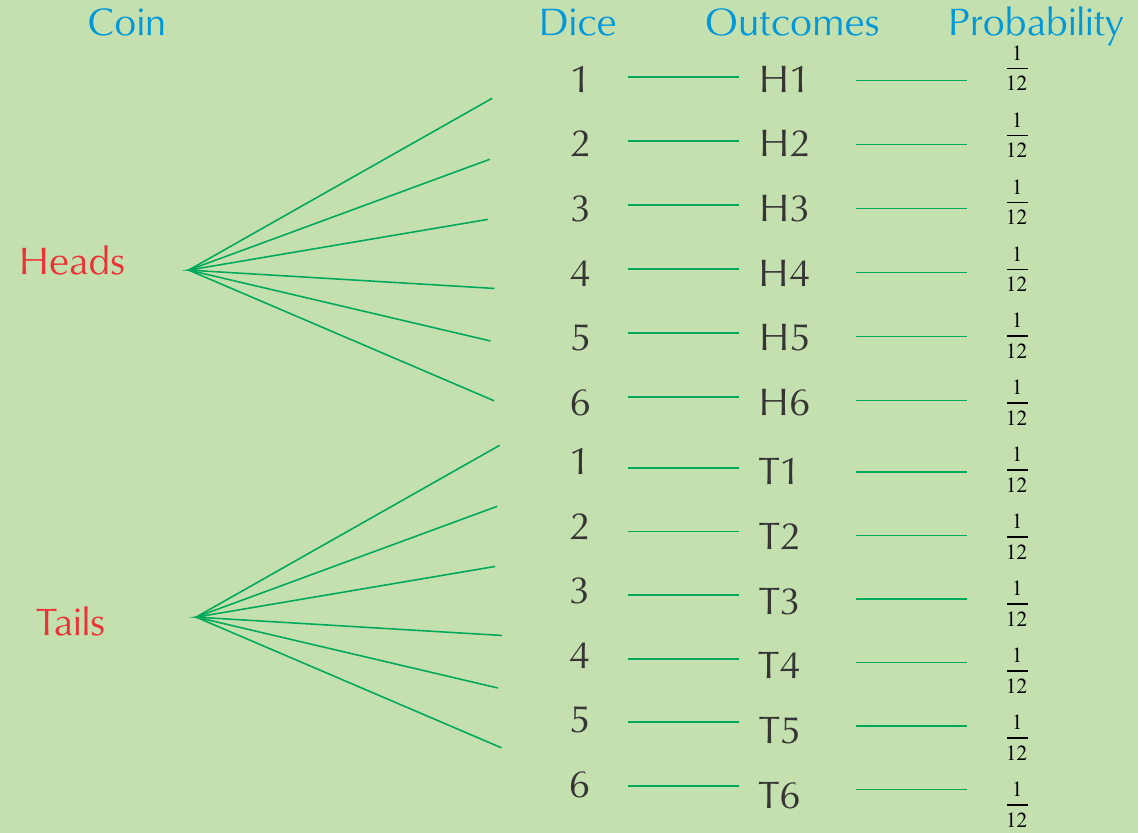
The tree diagram shows all possible outcomes for the compound event. There are 12 possible outcomes in total (6 outcomes for each coin result), and each outcome has a probability of .
Worked Example: Using a tree diagram for combined outcomes
Question: The tree diagram below shows all possible outcomes for tossing a coin and then throwing a dice.
- How many possible outcomes are there?
- What is the probability of getting each outcome?
- How many possible outcomes include getting an even number on the dice?
- How many possible outcomes include getting tails and an even number?
- How many possible outcomes include getting a 5 on the dice?
Solution:
- There are 12 possible outcomes altogether.
- The probability is .
- H2; H4; H6; T2; T4; T6 - six of them.
- T2; T4; T6 - three possible outcomes.
- H5 and T5 - two possible outcomes.
Two-way tables for combined outcomes
A two-way table (also known as a contingency table) works in a similar way to a tree diagram. We write the outcomes of one event in rows and the outcomes of the other event in columns.
For example, this table shows all possible combinations for tossing a coin twice:
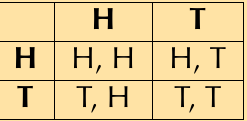
So each block in the table shows a possible outcome of the combined events.
Worked Example: Using a two-way table for combined outcomes
Question: Draw up a two-way table to show all possible outcomes for tossing a red dice and a blue dice.
Solution:
| Blue/Red | R1 | R2 | R3 | R4 | R5 | R6 |
|---|---|---|---|---|---|---|
| B1 | (B1; R1) | (B1; R2) | (B1; R3) | (B1; R4) | (B1; R5) | (B1; R6) |
| B2 | (B2; R1) | (B2; R2) | (B2; R3) | (B2; R4) | (B2; R5) | (B2; R6) |
| B3 | (B3; R1) | (B3; R2) | (B3; R3) | (B3; R4) | (B3; R5) | (B3; R6) |
| B4 | (B4; R1) | (B4; R2) | (B4; R3) | (B4; R4) | (B4; R5) | (B4; R6) |
| B5 | (B5; R1) | (B5; R2) | (B5; R3) | (B5; R4) | (B5; R5) | (B5; R6) |
| B6 | (B6; R1) | (B6; R2) | (B6; R3) | (B6; R4) | (B6; R5) | (B6; R6) |
There are 36 possible outcomes.
The chance of rolling a 3 on the blue dice (and any number on the red dice) is .
The probability of getting a 5 on the blue dice is or 0.17 or 16.67%.
The chance of rolling a 4 on the red dice and a 2 on the blue dice is .
Fair and unfair games
Fair games are games where there is an equal chance of winning or losing. If a game is fair, then the probability of winning equals the probability of losing.
Many games of chance are designed to make one person have a better chance of winning than the other. Every now and then, the loser will win, which gives them confidence to carry on playing! However, if the game is weighted towards one player, then that person will always win in the end.
When you know the chance of a particular event, you can make predictions about the probability of it happening. A fair game is one in which there is an equal chance of winning or losing.
If you change the rules, you can make the game less fair. For example, if someone wins a game of dice only if they get a 3, is it a fair game? No, because the probability of getting a 3 is only , while the probability of not getting a 3 is .
Exam tips
Understanding how to approach probability problems will help you succeed in examinations. Here are some essential strategies:
- Always check if a game is fair by comparing the probability of winning to the probability of losing
- In fair games, P(winning) = P(losing) = 0.5 or 50%
- Use tree diagrams for clear visualisation of all possible outcomes
- Two-way tables are especially useful for compound events with two different objects
- Remember that theoretical probability is what we calculate, while relative frequency is what we actually observe in experiments
- The more trials you conduct, the closer your relative frequency should get to the theoretical probability
Key Points to Remember:
- Random events cannot be influenced and have equal chances of occurring in fair games
- Theoretical probability is calculated mathematically, while relative frequency comes from experimental results
- Tree diagrams show all possible outcomes branching from a starting point, with probabilities clearly marked
- Two-way tables organise combined outcomes in rows and columns, making it easy to count total possibilities
- Fair games have equal probabilities of winning and losing (50% each), while unfair games favour one outcome over another