Drawing Figures on the Cartesian Plane (Grade 10 NSC Matric Mathematics): Revision Notes
Drawing Figures on the Cartesian Plane
Introduction to analytical geometry
Analytical geometry focuses on examining geometric properties, relationships, and measurements of points, lines, and angles using the Cartesian coordinate system. This mathematical approach allows us to define and study geometric shapes using coordinate points and algebraic principles.
The Cartesian plane consists of two perpendicular axes (x-axis horizontal, y-axis vertical) that create a grid system for locating points precisely. Every point on this plane can be identified using an ordered pair of numbers called coordinates, written as .
The Cartesian coordinate system is named after René Descartes, the French mathematician who developed this method of combining algebra and geometry. This system forms the foundation for analytical geometry and is essential for describing geometric relationships mathematically.
Understanding coordinate plotting
When you are given the coordinates of vertices for a geometric figure, you can draw the complete figure on the Cartesian plane by following these steps:
- Locate each point using its coordinates
- Plot the points accurately on the grid
- Connect the points in the correct order to form the figure
Worked Example: Drawing a quadrilateral
Consider quadrilateral ABCD with coordinates: , , , and .
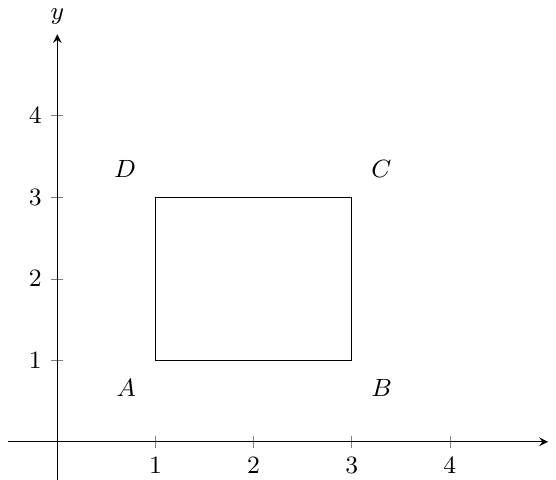
Step 1: Plot point at coordinates
Step 2: Plot point at coordinates
Step 3: Plot point at coordinates
Step 4: Plot point at coordinates
Step 5: Connect the points in alphabetical order:
The diagram shows how these coordinates create a perfect square when the points are connected in order.
Important naming conventions
The sequence of letters when naming geometric figures is crucial because it indicates the precise order in which points must be connected. For the quadrilateral above:
- Connect A to B, then B to C, then C to D, and finally D back to A
- This creates the complete figure following the vertex order
Critical Naming Rules:
- Alphabetical order: Although you could name the same figure as ABCD, CBAD, or BADC, it is conventional to use alphabetical order
- Consistent labelling: Always refer to the figure using the same letter sequence throughout your work
- Alternative notation: Coordinates may also be written as instead of just stating "point A is at "
Reading coordinates from graphs
A vital skill in analytical geometry is determining coordinates by reading plotted points from coordinate grids. This requires careful observation of where each point intersects the grid lines.
Steps for reading coordinates:
- Identify the x-coordinate by reading horizontally to the y-axis
- Identify the y-coordinate by reading vertically to the x-axis
- Write coordinates in the correct order
Practice reading coordinates from different quadrants to build confidence with positive and negative values. Remember that coordinates in different quadrants will have different sign combinations:
- Quadrant I:
- Quadrant II:
- Quadrant III:
- Quadrant IV:
Working with different naming patterns
When studying geometric figures, you may encounter various naming approaches. However, understanding the correct conventions helps ensure clear mathematical communication.
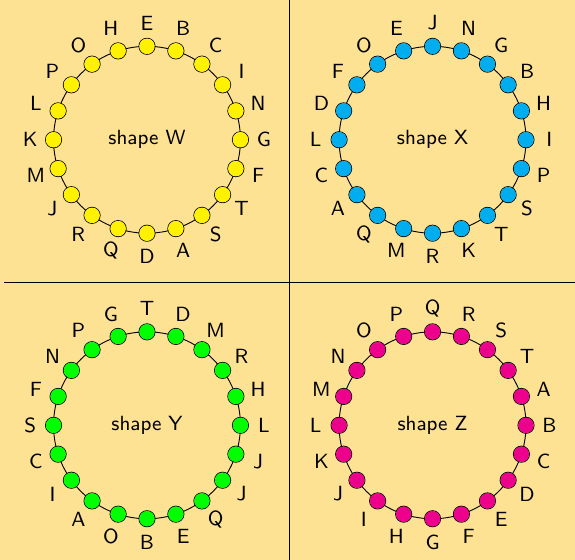
The diagram illustrates different approaches to naming identical circular arrangements. Shape Z demonstrates the correct naming convention by following proper alphabetical sequencing.
Exam tips and techniques
Essential strategies:
- Double-check coordinates: Always verify both x and y values when plotting points
- Use alphabetical order: This prevents confusion and follows mathematical conventions
- Count grid squares carefully: Accuracy in plotting determines the correctness of your figure
- Label clearly: Make sure all vertex labels are visible and correctly positioned
Common mistakes to avoid:
- Mixing up x and y coordinates (remember: x comes first)
- Connecting vertices in the wrong order
- Misreading negative coordinates in different quadrants
- Using inconsistent naming throughout a problem
Worked examples
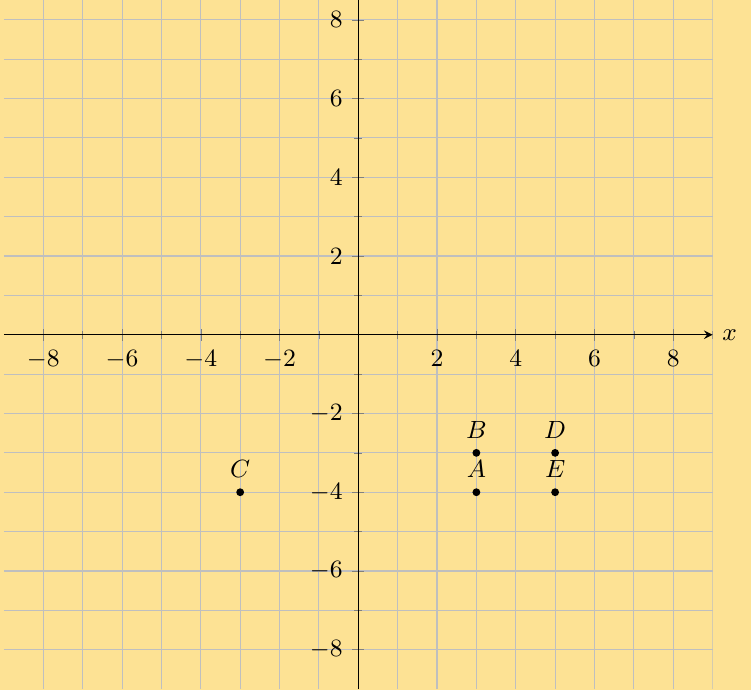
Worked Example 1: Plotting and connecting points
Given points , , , , and , plot these points accurately on a coordinate grid.
Solution approach:
- Start at the origin
- For each coordinate, move horizontally first (x-value), then vertically (y-value)
- Mark each point clearly with its corresponding letter
- Check that points in different quadrants have appropriate positive/negative coordinates
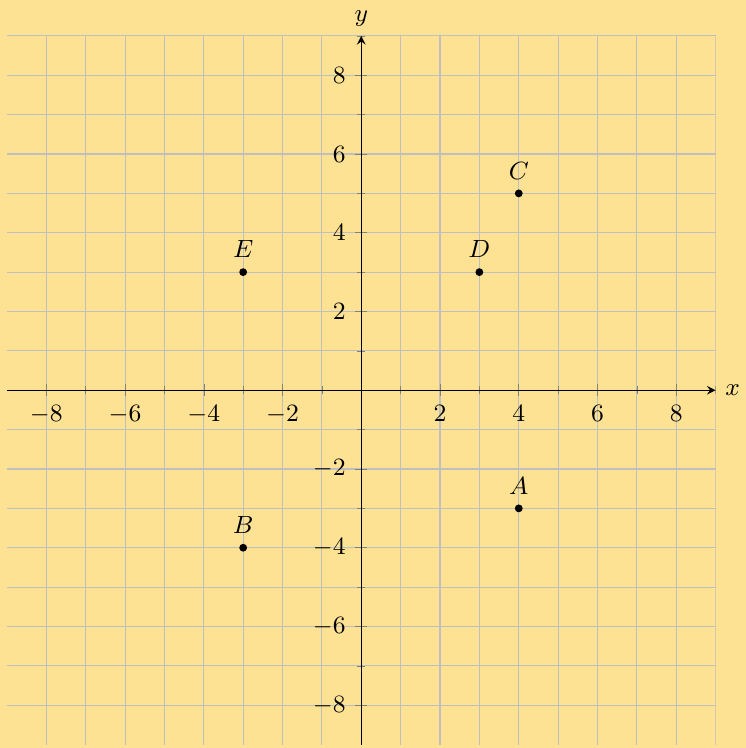
Worked Example 2: Reading coordinates from a plotted graph
From a given coordinate grid with plotted points, determine the exact coordinates of each labelled point.
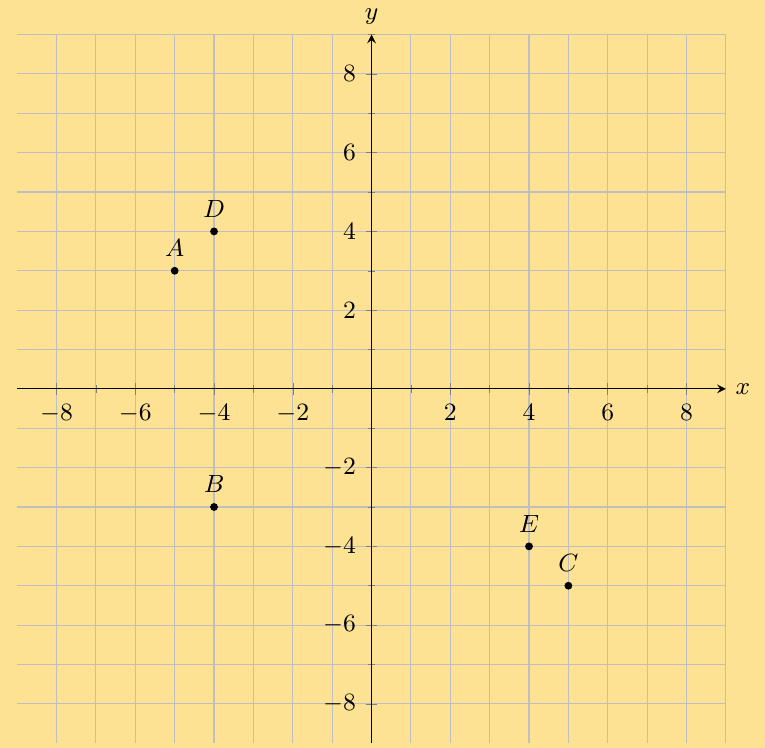
Reading strategy:
- Point A: Located at in the second quadrant
- Point B: Located at in the third quadrant
- Point C: Located at in the fourth quadrant
- Point D: Located at in the second quadrant
- Point E: Located at in the fourth quadrant
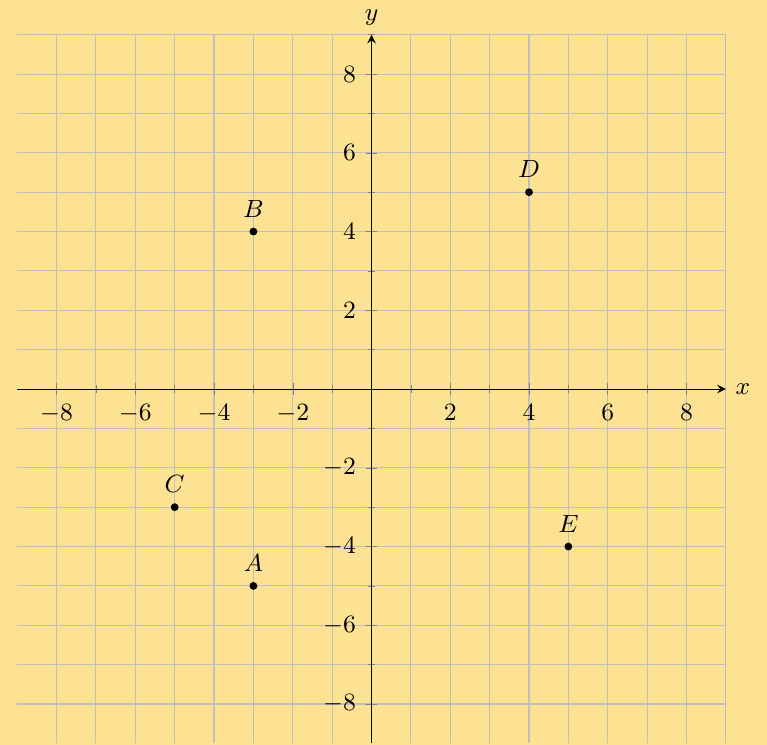
Worked Example 3: Identifying specific coordinates
Given a coordinate grid, find which point lies at coordinates .
Analysis method:
- Move 5 units right from the origin (positive x-direction)
- Move 4 units down from that position (negative y-direction)
- Identify which labelled point occupies this location
Key Points to Remember:
- Coordinates are always written as - horizontal position first, then vertical position
- The order of vertices matters when naming geometric figures as it shows the connection sequence
- Use alphabetical order for naming geometric figures to follow mathematical conventions
- Check all four quadrants when reading coordinates, paying attention to positive and negative signs
- Plot points accurately by counting grid squares carefully to ensure correct figure construction