Measures of Dispersion (Grade 10 NSC Matric Mathematics): Revision Notes
Measures of Dispersion
Understanding how data is spread out around the centre is just as important as knowing the central tendency. Two data sets can have the same mean but completely different patterns of distribution. Dispersion refers to how values in a dataset are distributed around the centre, and there are several ways to measure this spread.

The diagram above shows two data sets with identical means but very different spreads. This illustrates why we need measures of dispersion to fully understand our data - the mean alone doesn't tell us the complete story about how our data behaves.
Range
Range is the simplest measure of dispersion and tells us the total spread of our data.
Definition: The range of a data set is the difference between the maximum and minimum values in the set.
Formula: Range = Maximum value - Minimum value
The range shows us how far apart the largest and smallest values are in our dataset. However, the range is very sensitive to outliers - unusual values that are much larger or smaller than the rest of the data.
Worked Example: Finding the Range
Question: Find the range of the following data set: {1; 4; 5; 8; 6; 7; 5; 6; 7; 4; 10; 9; 10}
What would happen if we removed the first value from the set?
Solution:
Step 1: Determine the range
The smallest value in the data set is 1 and the largest value is 10.
Range = 10 - 1 = 9
Step 2: Remove the first value
If we removed the first value (1) from the set, the minimum value would become 4.
The new range would be 10 - 4 = 6.
Notice how removing just one outlier significantly changed the range from 9 to 6. This shows that the range is heavily influenced by extreme values and may not always give us the best picture of how our data is typically spread out.
Percentiles
Percentiles give us a much more detailed picture of how data is distributed by dividing the dataset into 100 equal parts.
Definition: The th percentile is the value, , that divides a data set into two parts, such that percent of the values in the data are less than and percent of the values are greater than . Percentiles can lie in the range .
Understanding value, rank and percentile
To work with percentiles effectively, we must understand three different aspects of data:
- The value of a datum is what we measured and recorded during an experiment or survey
- The rank of a datum is its position in the sorted data set (first, second, third, etc.)
- The percentile tells us what percentage of the values in the full data set are less than this datum
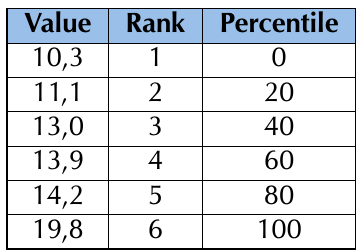
The table above shows how these three concepts relate to each other for a sample dataset. Understanding this relationship is crucial for working with percentiles effectively.
The percentile formula
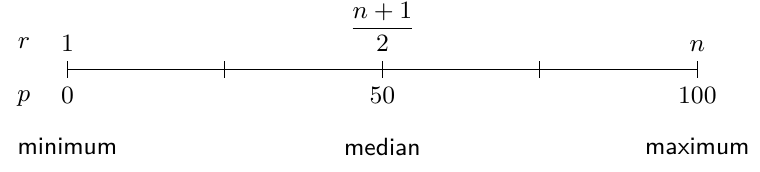
The relationship between rank and percentile can be understood using this mapping diagram. For any ordered data set with values, we can find the rank of the th percentile using:
Formula:
This gives us the rank, , of the th percentile. To find the actual value of the th percentile, we count from the first value in the ordered data set up to the th value.
When the rank is not a whole number, the percentile lies between two values in the data set. The convention is to take the value halfway between the two values indicated by the rank.
Worked Example: Using the Percentile Formula
Question: Determine the minimum, maximum and median values of the following data set using the percentile formula: {14; 17; 45; 20; 19; 36; 7; 30; 8}
Solution:
Step 1: Sort the values in the data set
Before using ranks to find values, we must always order the values from smallest to largest.
Sorted data set: {7; 8; 14; 17; 19; 20; 30; 36; 45}
Step 2: Find the minimum
The minimum is equivalent to the 0th percentile. Using the percentile formula with and :
This confirms that the minimum value is the first value in the list, namely 7.
Step 3: Find the maximum
The maximum is equivalent to the 100th percentile. Using the percentile formula with and :
This confirms that the maximum value is the last (ninth) value in the list, namely 45.
Step 4: Find the median
The median is equivalent to the 50th percentile. Using the percentile formula with and :
This shows that the median is in the middle (fifth position) of the ordered data set. Therefore, the median value is 19.
Quartiles
Quartiles are special percentiles that divide an ordered data set into four equal groups.
Definition: The quartiles are the three data values that divide an ordered data set into four groups, where each group contains an equal number of data values. The median (50th percentile) is the second quartile (Q2). The 25th percentile is also called the first or lower quartile (Q1). The 75th percentile is also called the third or upper quartile (Q3).
- Q1 (First quartile) = 25th percentile
- Q2 (Second quartile) = 50th percentile = median
- Q3 (Third quartile) = 75th percentile
Worked Example: Finding Quartiles
Question: Determine the quartiles of the following data set: {7; 45; 11; 3; 9; 35; 31; 7; 16; 40; 12; 6}
Solution:
Step 1: Sort the data set {3; 6; 7; 7; 9; 11; 12; 16; 31; 35; 40; 45}
Step 2: Find the ranks of the quartiles
Using the percentile formula with :
For Q1 (25th percentile):
For Q2 (50th percentile):
For Q3 (75th percentile):
Step 3: Find the values of the quartiles
Since each rank is a fraction, the quartile values lie between two values from the data set.
For Q1: The rank is 3.75, which is between the third and fourth values. Since both values are 7, the 25th percentile is 7.
For Q2: The rank is 6.5, meaning halfway between the sixth and seventh values. The sixth value is 11 and the seventh value is 12, so the median is .
For Q3: The rank is 9.25, meaning between the ninth and tenth values. Therefore, Q3 is .
Deciles
Deciles divide an ordered data set into ten equal groups, where each group contains an equal number of data values. The nine decile values are the 10th, 20th, 30th, 40th, 50th, 60th, 70th, 80th, and 90th percentiles.
Deciles are useful when you want more detail than quartiles but don't need the full granularity of percentiles. They're commonly used in educational assessment and statistical analysis.
Percentiles for grouped data
When data is presented in a frequency table rather than as individual values, we need a modified approach to find percentiles.
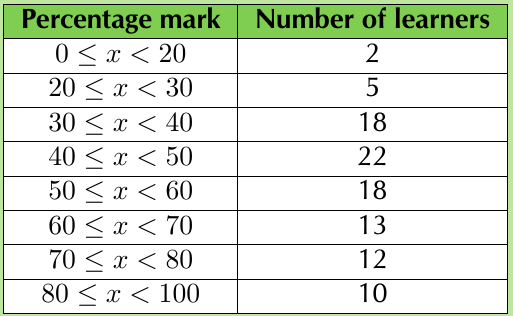
Worked Example: Percentiles in Grouped Data
Question: The mathematics marks of 100 grade 10 learners at a school have been collected and presented in the frequency table above.
- Calculate the mean of this grouped data set
- In which intervals are the quartiles of the data set?
- In which interval is the 30th percentile of the data set?
Solution:
Step 1: Calculate the mean
For grouped data, we approximate the mean by assuming all learners in each interval scored the central value of that interval.
Mean =
Step 2: Find the quartiles
Using the percentile formula with :
Now we find which ranges these ranks fall into:
- For Q1: There are 25 learners in the first three ranges combined. Since , Q1 lies in the third range: 30 ≤ x < 40
- For Q2: There are 47 learners in the first four ranges combined. Since , Q2 lies in the fifth range: 50 ≤ x < 60
- For Q3: There are 78 learners in the first six ranges combined. Since , Q3 lies in the sixth range: 60 ≤ x < 70
Step 3: Find the 30th percentile
Since there are 25 learners in the first 3 ranges and 47 learners in the first 4 ranges, the 30th percentile lies in the fourth range: 40 ≤ x < 50
Ranges based on quartiles
We can define more sophisticated measures of dispersion using percentiles that are less affected by extreme values.
Interquartile range (IQR): The interquartile range is a measure of dispersion calculated by subtracting the first quartile (Q1) from the third quartile (Q3). This gives the range of the middle half of the data set.
Formula: IQR = Q3 - Q1
Semi interquartile range: The semi interquartile range is half of the interquartile range.
Formula: Semi IQR =
The interquartile range is less sensitive to outliers than the full range because it focuses on the middle 50% of the data and ignores the extreme values. This makes it a more robust measure of spread for datasets that contain outliers.
Key Points to Remember:
- Range = Maximum - Minimum (simple but sensitive to outliers)
- Percentiles divide data into 100 parts using the formula
- Quartiles are the 25th, 50th, and 75th percentiles that divide data into four equal parts
- Interquartile range = Q3 - Q1 (measures the spread of the middle 50% of data)
- Always sort your data first before calculating any percentile-based measures
- IQR is more robust than range when dealing with datasets containing outliers