Analysing Data and Information (Grade 11 NSC Matric Computer Application Technology): Revision Notes
Analysing Data and Information
Once you have collected and formatted your data, the next crucial step is to analyse your results and draw meaningful conclusions. This process helps you answer your research questions by identifying trends and patterns in your data. Let's explore how to verify your data, apply data questions, and analyse trends and patterns effectively.
Adding data questions
After verifying that your data is accurate and reliable, you can begin applying specific data questions to help categorise and organise your information. These questions, which you learned about in Grade 10, are essential tools for making sense of your data:
The Five Essential Data Questions:
- How many? - This helps you count and quantify your data
- What is most popular? - This identifies the most frequently occurring values
- What is least common? - This finds the rarest occurrences in your dataset
- How many more than? - This allows you to make comparisons between different data points
- What is the average? - This helps you find the central value of your data
These questions serve as a foundation for deeper analysis and help you move from raw data to meaningful insights that can answer your original research question.
Understanding trends and patterns
The final and most important step in data analysis involves looking for trends and patterns. While these terms might seem similar, they represent different aspects of data behaviour and require different analytical approaches.
What are trends?
Trends show the general tendency of data to move in a particular direction over time. In a trend, individual data points may vary slightly, but they all move in the same overall direction. Think of trends as the "big picture" movement of your data across a time period.
Types of trends
Upward trends
An upward trend occurs when data points generally increase over time. A perfect example is global temperature data, where scientists have been recording surface temperatures for over 100 years. Despite some variation between hot and cold periods, the overall trend shows temperatures rising consistently.
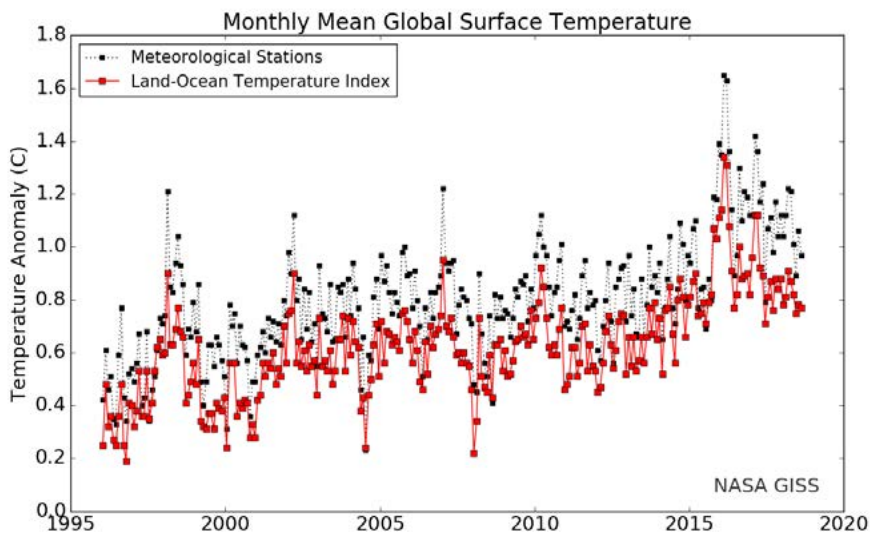
This type of pattern demonstrates how data can show clear directional movement despite short-term fluctuations.
Downward trends
A downward trend happens when data points decrease over time. Technology costs provide an excellent illustration of this concept. The cost of computer storage has dramatically fallen since the 1980s, moving from over a million dollars per gigabyte to less than ten cents today.
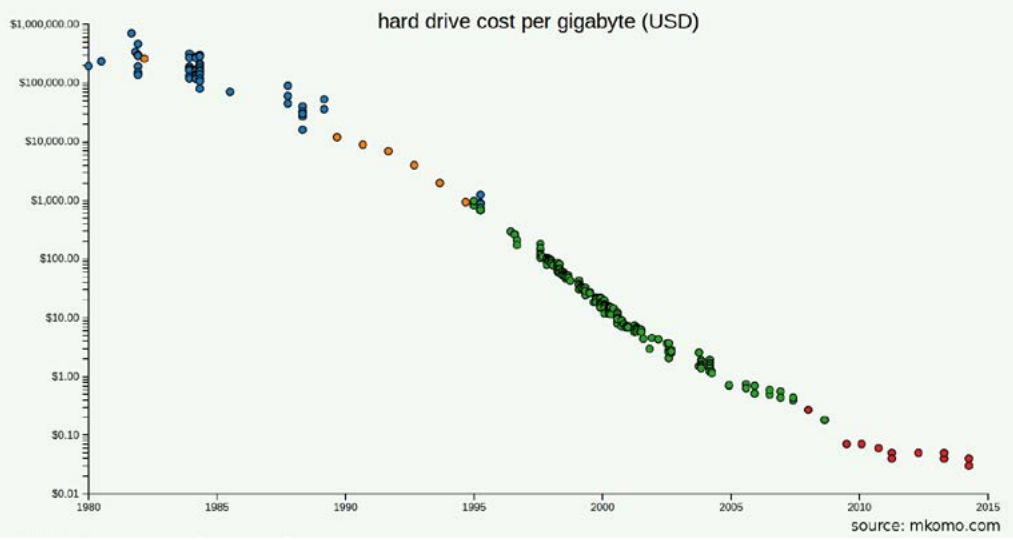
Worked Example: Technology Cost Trends
Consider the cost of computer memory over time:
- 1980s: $1,000,000+ per gigabyte
- 2000s: 1,000 per gigabyte
- 2020s: 1.00 per gigabyte
This demonstrates a clear downward trend where costs decrease exponentially as technology advances.
Correlation trends
Sometimes you might notice a relationship between two variables moving in opposite directions. This is called a correlation trend. For instance, as computing technology improves and becomes more powerful, the cost typically decreases. This inverse relationship shows how one factor influences another in a predictable way.
Step changes
Unlike gradual upward or downward trends, step changes show sudden, dramatic increases or decreases. Petrol prices often exhibit this behaviour, changing slowly for periods and then jumping up or down significantly based on external factors like oil costs.

Understanding Step Changes
Step changes are different from gradual trends because they represent sudden, significant shifts in data rather than slow, consistent movement. These often result from external events or policy changes that immediately impact the data being measured.
Other trend types
Data can also show daily and seasonal cycles, where patterns repeat over specific time periods. These might include daily temperature variations or seasonal sales patterns in retail businesses.
Data patterns
Patterns differ from trends because they don't necessarily involve movement over time. Instead, patterns describe how data distributes itself or what shape it forms when displayed visually. Understanding patterns helps you see the underlying structure of your data.
Types of data patterns
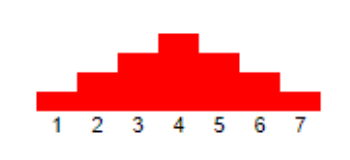
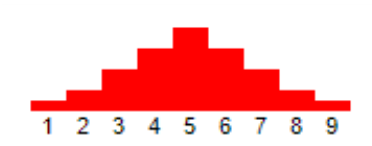
Central patterns
Central patterns occur when your data has a median value sitting in the middle of all values when arranged from smallest to largest. This creates a symmetrical distribution where most data points cluster around the centre value, with fewer points at the extremes.
Spread patterns
Spread patterns show how much your data varies across its range. When data has a wide range, the spread is larger, meaning your data points are more scattered. When the range is narrow, the spread is smaller, indicating your data points are closer together. Understanding spread helps you assess the consistency of your data.
Shaped patterns
Shaped patterns emerge when data forms distinctive shapes on charts or graphs. The most common shaped patterns are skewed distributions:
- Right-skewed data: Most values cluster towards the lower end, with a few high values creating a "tail" extending right
- Left-skewed data: Most values cluster towards the higher end, with a few low values creating a "tail" extending left
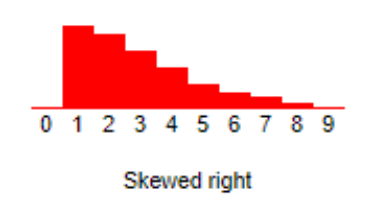
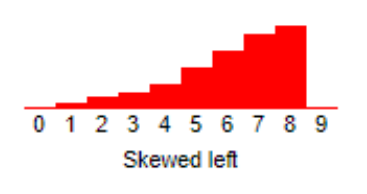
These patterns help you understand whether your data is evenly distributed or weighted towards one side.
Practical applications
Worked Example: Systematic Data Analysis Process
When analysing your data, follow this systematic approach:
Step 1: Start with basic data questions to understand what your data contains
Step 2: Look for time-based trends if your data spans different periods
Step 3: Examine the distribution patterns to understand how your data spreads
Step 4: Consider correlations between different variables in your dataset
Step 5: Watch for unusual changes that might indicate step changes or external influences
Understanding these analytical tools helps you move beyond simply collecting data to actually gaining insights that can inform decisions and answer important questions.
Key Points to Remember:
- Data questions help organise information: Use the five key questions (How many?, What is most popular?, etc.) to systematically analyse your data
- Trends show direction over time: Look for upward, downward, correlation, and step change patterns in time-based data
- Patterns describe data distribution: Central, spread, and shaped patterns reveal how your data is structured
- Verification comes first: Always ensure your data is accurate before beginning analysis
- Visual representation helps: Charts and graphs make trends and patterns easier to identify and understand